Chapter 32 of 60 in the Bangladesh 2036 research base. Contents of the series.
From school places to learning and work
Enrolment expanded faster than the system’s ability to keep adolescents in school and connect training to work. The next task is to improve learning, secondary retention and employer involvement in vocational education. Smaller school cohorts may ease pressure on resources, but that benefit depends on actual enrolment, staffing and budget choices.

Enrolment, retention and teaching capacity
The primary tier is a finished construction site. Net enrolment of 97.56 percent in 2022 from 94.80 percent in 2010, dropout down from 39.80 to 13.95 percent, and survival to the end of the cycle up from 67.25 to 86.85 percent are the chapter 09 figures and they carry its tag [BANBEIS 2022]. The pre primary tier that feeds it is the newest and least settled: gross pre primary enrolment reached 45.60 percent in 2020 and fell to 36.38 percent in the pandemic print of 2021 [WB WDI 2026]. Above the primary tier the system leaks.
Primary age children out of school stood at 5.86 percent in 2024, and adolescents of lower secondary age out of school at 23.94 percent, after 18.14 percent in 2021 and 10.73 percent in 2017 [WB WDI 2026]. The doubling of the adolescent exit rate in seven years is the largest adverse education trend in the record and it arrives before the skills tier can reach the leavers.
The census literacy tables describe one dimension of educational attainment across districts. Learning outcomes require a separate assessment: the World Bank’s 2024 learning-poverty brief uses Bangladesh’s Grade 5 national learning assessment from 2022 [WB Learning Poverty 2024]. Literacy of the population aged seven and above averaged 73.48 percent across the 64 districts unweighted, from Pirojpur at 85.53 percent and Dhaka district at 84.88 down to Jamalpur at 61.70 percent, Sherpur at 63.70 and Bandarban at 63.74, a 23.83 percentage-point spread between the highest and lowest district readings [BBS Census 2022, district literacy tables].
The retrospective schooling tables of the flood microdata chapter 28 cites give the same geography in years of completed schooling: Barishal adults hold 5.44 mean years against 4.50 in Sylhet and 4.53 in Mymensingh, with the national mean at 5.05 years, urban 6.16 against rural 4.78 [Zenodo 2024, DOI 10.5281/zenodo.17240928]. The ranking is not the income ranking: Sylhet, one of the richer divisions, holds the lowest completed schooling in the country, which is the regional distribution chapter 14 and chapter 49 price in other denominators.
The teacher corps is the system's largest workforce and its deployment is tiered by sex and by management. The 2023 tier table counts 246,784 secondary school teachers, 54,892 in school and colleges, 111,327 in colleges, 118,280 in madrasahs, 34,621 in technical and vocational institutions and 32,917 in universities, 598,821 post primary teachers in all [BANBEIS 2023, tier table]. Teaching turns from a female profession at the bottom to a male one above it: 64.97 percent of primary teachers were women in 2022 [BANBEIS 2022, headline indicators], against 29.60 percent in secondary schools, 25.44 percent in technical institutions and 19.58 percent in madrasahs in 2023 [BANBEIS 2023, tier table].
Training shows the same tiered unevenness. The trained share of primary teachers rose from 47.58 percent in 2015 to 77.88 percent in 2024 [WB WDI 2026], one of the fastest quality inputs in the record; the secondary trained share printed 65.01 percent in 2023 and 55.01 percent in 2024, and the fall between the two prints is not explained in the cited reports, and could not be confirmed, with BANBEIS and UNESCO the resolving sources [WB WDI 2026].
The madrasa stream is a parallel system the state finances but does not operate. The 2022 education census counts 9,268 madrasahs of which 9,265 are private, teaching 2,762,277 students, 53.51 percent of them girls, with 119,008 teachers of whom 19.33 percent are women; the three public madrasahs hold 7,127 students, 7.00 percent girls [BANBEIS 2022, education census management table]. The stream is a third the size of the general secondary tier on the same table, and its teacher corps is nearly half the size of the secondary school corps, 118,280 against 246,784 in the 2023 tier table [BANBEIS 2023, tier table]. Its female enrolment share, 53.51 percent, is the quiet fact of the stream: the madrasah tier is majority female at the student level and among the most male staffed at the teacher level.
The technical and vocational tier is the smallest post primary tier and privately owned. The census counts 780,195 TVET students in 2022, 24.49 percent girls, in 2,547 institutions of which 2,225 are private; private institutions hold 500,499 students against 279,696 in the 322 public ones, 64.15 percent of enrolment [BANBEIS 2022, education census management table]. The public institutions run classrooms twice as full as the private ones, a student teacher ratio of 34 against 17, and enrol fewer girls, 17.65 percent of public students against 28.31 percent in private institutions [BANBEIS 2022, education census management table].
The Directorate of Technical Education's own account puts 188 public institutes under it, but its listed components, 50 polytechnics, 134 technical schools and colleges, 4 engineering colleges and 2 teachers training colleges, sum to 190; the total needs reconciliation, alongside the 83 technical training centres the manpower bureau runs for overseas skilling, and records the government's instrument for private TVET as teacher salary subsidies paid through the monthly pay order system [DTE 2023]. The World Bank series that counts vocational pupils inside secondary education shows the tier's rise and stall: 372,524 pupils in 2010, 757,289 in 2018, 27.64 percent of them female [WB WDI 2026], after which the census and tier table counts diverge from that series: 780,195 across all TVET in the 2022 census, above the 2018 WDI print, before falling to 689,745 in the 2023 tier table [BANBEIS 2022, education census management table] [BANBEIS 2023, tier table].
The financing record is a development budget that concentrates on the primary tier. The FY26 annual development programme allocates 28,557.43 crore BDT to the education sector across 94 projects, 12.42 percent of the 230,000.00 crore BDT programme, the figure chapter 09 cites [Planning Commission ADP 2025, ADP at a glance table]. On the ministry cut, 11,398.16 crore BDT goes to the primary and mass education ministry across 6 projects, 13,625.03 crore BDT to the secondary and higher education division across 56 projects, and 3,280.36 crore BDT to the technical and madrasah education division across 18 projects [Planning Commission ADP 2025, ministry wise allocation table].
The revised programme cut the sector to 18,550.93 crore BDT across 118 projects, 64.96 percent of the original allocation [Planning Commission ADP 2025, revised FY2025-26 project table]. The single largest line is the fourth primary education development programme, 5,349.38 crore BDT of FY26 allocation against a committed cost of 32,803.48 crore BDT and cumulative expenditure of 27,435.52 crore BDT, 83.64 percent spent [Planning Commission ADP 2025]. The skills tier's counterpart is the accelerating and strengthening skills for economic transformation project, 1,454.57 crore BDT of FY26 allocation against 4,300.00 crore BDT committed, with 122.87 crore BDT of cumulative expenditure, 2.86 percent of its cost [Planning Commission ADP 2025].
A school feeding programme carries 1,091.61 crore BDT of FY26 allocation against a 5,452.42 crore BDT cost and zero cumulative expenditure [Planning Commission ADP 2025]. What the development budget does not fund at any recorded scale is measurement: a separately labelled national assessment line was not identified in the project table reviewed here. That does not establish an absence of assessment spending, since an activity may sit within a larger programme. The learning-poverty estimate draws on a domestic Grade 5 assessment [WB Learning Poverty 2024].
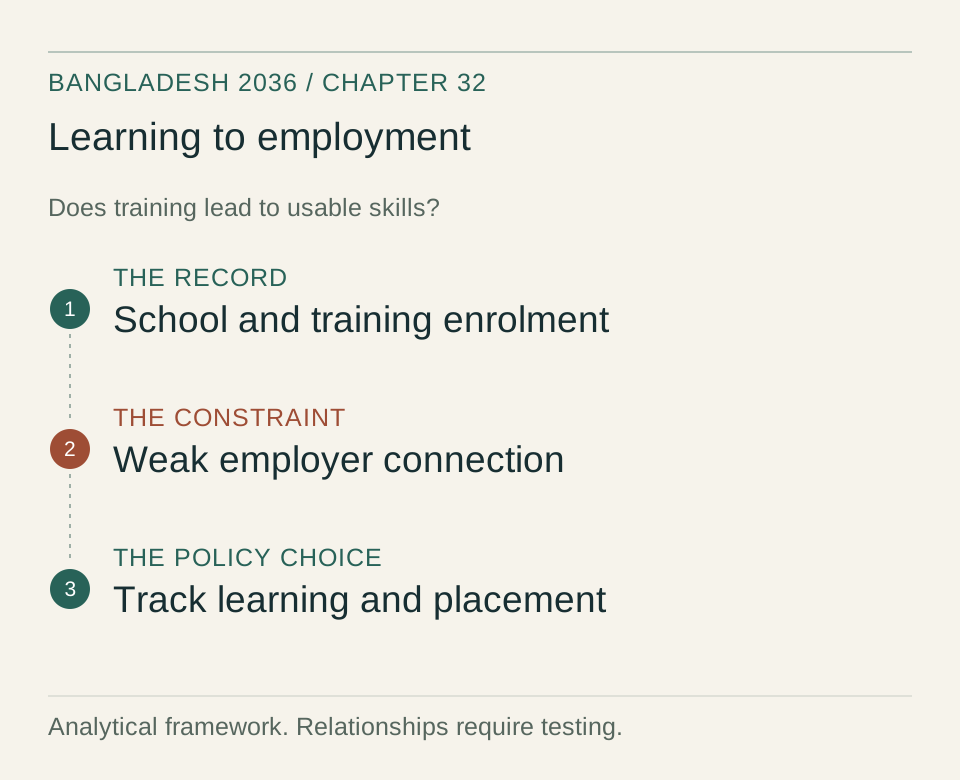
Why access has not assured learning
The education mechanism is a financing contract in which the state pays recurrent salaries and the household pays the margin. Three instruments built the enrolment record chapter 09 documents: the primary development programmes that nationalised teacher salaries and built schools, the female secondary stipend that paid families to keep daughters enrolled, and private delivery that absorbed demand at unit costs the state could afford. The delivery structure that resulted is the most privatised in the region: 96.68 percent of secondary schools and 94.05 percent of secondary students sat in private managed institutions in the 2022 census, on the management table, consistent with the 93.90 percent private share of secondary enrolment chapter 09 cites from the international series [BANBEIS 2022, education census management table] [WB WDI 2026].
The state holds this structure together with salary instruments, the monthly pay order subsidies for approved private teaching posts that the technical education directorate records as the instrument for vocational expansion in rural communities [DTE 2023]. The household side of the contract is the part the statistics do not measure: the household income and expenditure survey documents private tutoring and coaching as a first order education cost, but the series is not held in the cited reports, so any figure for the tutoring share of household education spending is not established; with the survey's education expenditure tables the resolving source [BBS HIES 2022].
Learning assessments exist, but their regular publication and use in school improvement need closer scrutiny. The programme table alone cannot establish how much is spent on assessment. Curriculum continuity is a separate question: the 2023 competency based curriculum began a staged rollout and was rolled back after the 2024 political transition, a sequence recorded in public statements but not in any document available to this chapter, and could not be confirmed, with the secondary and higher education division the resolving source. What is measured instead is throughput, and the throughput record itself now splits: the primary tiers complete at 94.30 percent [WB WDI 2026] while one adolescent in four exits before or within lower secondary [WB WDI 2026], so the system that filled primary seats is now generating its own inflow to child work and to the NEET stock chapter 08 dates at 15.43 percent of youth [WB WDI 2026].
The child labour survey puts school attendance among working children at 52.2 percent in 2022 [BBS NCLS 2022], the complementary number: nearly half the child labour force is outside school entirely.
The skills mechanism is a tier without a demand side. The export model documented in chapters 02 and 08 hired at the bottom of the skill distribution and trained on the job, which made the vocational tier and employer training optional for two decades; the enterprise record shows the option being withdrawn rather than exercised, firms offering formal training down from 21.90 percent in 2013 to 6.42 percent in 2022 [WB ES 2022]. The sector closest to the vocational tier's own curriculum shows the gap at worker level: among 2,500 garment workers surveyed in November 2023, 17.52 percent had received no formal occupational safety training at all [Zenodo 2023, DOI 10.5281/zenodo.17117330], a reading the factory safety regime chapter 17 documents did not reach the worker in one in six cases.
The market that does price skills, the Gulf labour market, tells the same story from the exit side: of the 1,305,453 workers who departed overseas in calendar 2023, 323,993 were recorded as skilled, 24.82 percent, against 654,781 recorded as less than skilled, 50.16 percent [BMET 2023], the skill mix chapter 21 traces by corridor. The TVET tier's institutional answer to this is a monitoring framework, not a market: the technical and madrasah education division, created by the 2016 split of the education ministry, governs the tier through a board that accredits courses and a 24 indicator performance framework whose own text records that some indicators carry targets but not all, including the two that would measure employer connection, the share of institutes with industry memoranda and the share of graduates served by job placement cells [DTE 2023].
A tier in which the employer connection indicators are untargeted is the institutional form of the 6.42 percent training rate.
Where the education budget can do more
The cohort arithmetic is the decade's gift and it is already visible in the counts. The UN medium variant projects fertility falling from 2.14 births per woman in 2024 to 1.92 by 2036 and the median age rising from 25.65 to 30.0 years [UN WPP 2024, medium variant]. The school age tail has turned first: primary pupils fell from 17.60 million in 2020 to 16.69 million in 2024 and secondary pupils from 16.07 million in 2022 to 15.07 million in 2024 [WB WDI 2026]. A system whose enrolment base has fewer pupils while its budget holds flat is a system whose per student resources rise without a single new allocation, and the reform scenario in chapter 15 assumes the dividend is spent on quality, teachers and assessment, rather than absorbed by the wage bill.
Five decisions define the window, with the responsible institutions identified. The learning measurement decision, led by the primary and mass education ministry with BANBEIS, is whether a national learning assessment becomes routine public data before the fourth primary programme closes, building on the domestic assessment underlying the 51.22 percent learning-poverty estimate, with published methods and results [WB WDI 2026] [WB Learning Poverty 2024]. The retention decision, led by the secondary and higher education division with the education boards, is whether the lower secondary exit rate of 23.94 percent is treated as the system's headline problem; the instrument set, stipends, feeding and the stalled learning acceleration project at 490.76 crore BDT of FY26 allocation against 3,304.08 crore BDT committed [Planning Commission ADP 2025], exists in pieces.
The curriculum decision, led by the same division, is whether a consolidated curriculum survives the political cycle without a third reversal; the current status could not be confirmed, with the division the resolving source. The skills execution decision, led by the technical and madrasah education division and the Directorate of Technical Education with World Bank financing, is whether the 4,300.00 crore BDT skills project converts its 2.86 percent spend rate into institute level output, and whether the 24 indicator framework's employer connection indicators acquire targets and values [DTE 2023] [Planning Commission ADP 2025].
The madrasah mainstreaming decision, led by the same division, is whether the 2.76 million student stream, majority female, is brought into the technical and mainstream pathways its division's mandate names, with the 700.70 crore BDT madrasah development line as the financing handle [BANBEIS 2022, education census management table] [Planning Commission ADP 2025]. The migration skills decision, led by the manpower bureau with the technical education directorate, runs through the same 83 technical training centres [DTE 2023] and the corridor demand chapter 21 projects.
No projected education financing path to FY36 is stored in the cited reports, so any spending path number is not established; with the ministry's medium term budget framework the resolving source. What the decade inherits instead is a base: 28,557.43 crore BDT of development allocation in the published programme and 18,550.93 crore in the revised one, a primary programme 83.64 percent executed, and a skills project 2.86 percent executed, the two ends of the execution spectrum in one budget table [Planning Commission ADP 2025].
How to test the argument. The Directorate of Technical Education should connect project execution to independently measured skills and employment after training. If spending and certificates rise without better placement or employer demand, completing facilities would not be sufficient evidence of a successful skills policy.
Risks and opportunities
Risks. First, the exit wave compounds: the adolescent out of school rate doubled to 23.94 percent in seven years [WB WDI 2026], and each exit cohort feeds the working child stock, whose school attendance already runs at 52.2 percent [BBS NCLS 2022], and the NEET stock chapter 08 dates; monitor the annual out of school prints and the next child labour survey. Second, a skills tier that is a shell: if the 4,300.00 crore BDT skills project stays near its 2.86 percent execution [Planning Commission ADP 2025] while firms' training remains at 6.42 percent [WB ES 2022], the tier will keep certifying graduates into a market that prices them at the less than skilled rate of 50.16 percent of departures [BMET 2023]; monitor the project's cumulative expenditure and the first measured values of the industry memorandum and placement cell indicators [DTE 2023].
Third, a regional lock in: the 23.83 point district literacy spread of the census [BBS Census 2022] and the division schooling table with Sylhet at the bottom [Zenodo 2024, DOI 10.5281/zenodo.17240928] describe a stock that reproduces itself through the quality of local teacher deployment, and monitor the district literacy and completion tables against the next survey round.
Upside. First, the cohort dividend is measured, not projected: primary enrolment fell by 0.91 million between 2020 and 2024, and secondary enrolment by 1.00 million between 2022 and 2024; these are different comparison periods [WB WDI 2026], so a fixed total budget could provide more resources per pupil, subject to inflation, staffing and where enrolment falls. Second, the skills instrument exists and is financed: 4,300.00 crore BDT of committed cost with 1,454.57 crore BDT of FY26 allocation is the largest skills line in the record, and its execution converts directly into institutes, teachers and the employer connections the framework currently leaves untargeted [Planning Commission ADP 2025] [DTE 2023].
Third, the female schooling base is the participation lever: 55.05 percent of secondary students, 53.51 percent of madrasah students and a majority female primary teacher corps are the pipeline chapters 08 and 35 price, and the vocational tier's female share, 27.50 percent [BANBEIS 2023, tier table], is the single number whose rise would move participation, earnings and the human capital gender gap chapter 09 measures at the same time.
Education indicators to follow
The benchmarks below are author-proposed monitoring points, not validated causal cutoffs or official forecasts.
- Lower secondary age adolescents out of school. Current value 23.94 percent in 2024, from 10.73 percent in 2017 [WB WDI 2026]. Proposed benchmark: a print above 30 percent may indicate the exit regime is structural; a fall below 15 percent would indicate the retention turn the reform scenario assumes.
- Trained teacher share in secondary education. Current value 55.01 percent in 2024, against 77.88 percent in primary [WB WDI 2026]. Proposed benchmark: a print below 50 percent may indicate the deployment crisis at the tier where the exit happens; a recovery above 70 percent, the primary benchmark, would indicate the quality input reached secondary.
- TVET enrolment as a share of the general secondary tier. Current value 8.45 percent in 2023, on the tier table [BANBEIS 2023, tier table]. Proposed benchmark: a share above 15 percent by FY30 is the skills turn the reform scenario targets; a share still below 10 percent may indicate the tier is a shell.
- Cumulative expenditure of the skills transformation project against committed cost. Current value 2.86 percent, 122.87 of 4,300.00 crore BDT, at FY26 [Planning Commission ADP 2025]. Proposed benchmark: execution above half of committed cost by FY30 is the pace the reform scenario assumes; stagnation below a quarter may indicate the stalled line.
- Learning poverty rate. Current value 51.22 percent in the 2022 measurement [WB WDI 2026]. Proposed benchmark: chapter 09's thresholds stand, a print below 40 percent would indicate the quality turn, above 55 percent may indicate the lock in; the revealing institutional event is the first nationally produced learning measurement, whichever direction it prints.
Sources
[WB Learning Poverty 2024] World Bank, Bangladesh Learning Poverty Brief, April 2024. Grade 5 national learning assessment from 2022 underlies the learning-deprivation estimate. Source link
[WB WDI 2026] World Bank World Development Indicators via bdpolicy parquet wb_full_bd: out of school rates by tier, pre primary enrolment, trained teachers by tier, vocational pupils, enrolment counts, private enrolment share, learning poverty, NEET, completion and expenditure series, values in data/32-education-tvet-skills.csv.
[BANBEIS 2022] Bangladesh Bureau of Educational Information and Statistics via bdpolicy parquets banbeis_headline_indicators_bd and banbeis_education_census_2022: primary enrolment, dropout and survival series, primary female teacher share, and the education census management table by tier, institutions, teachers and students.
[BANBEIS 2023] Bangladesh Bureau of Educational Information and Statistics via bdpolicy parquet banbeis_institutions_students_by_tier, institutions, teachers by sex, students and student teacher ratios by tier, 2023.
[BBS Census 2022] Bangladesh Bureau of Statistics, Population and Housing Census 2022, district literacy rate tables aged seven and above via bdpolicy parquet bbs_census_district_literacy_rates.
[BBS NCLS 2022] Bangladesh Bureau of Statistics, National Child Labour Survey 2022, school attendance among child labourers, via bdpolicy.db series bbs_child_labour_school_attendance.
[BBS HIES 2022] Bangladesh Bureau of Statistics, Household Income and Expenditure Survey 2022, education expenditure tables including private tutoring, resolving source, tables not held in the sources this chapter draws on.
[Zenodo 2024] Zenodo 1988 flood schooling microdata with division, urban and rural schooling tables, DOI 10.5281/zenodo.17240928, via bdpolicy.db series edu_national_mean_schooling_years, edu_urban_mean_schooling_years, edu_rural_mean_schooling_years and the division benchmark table.
[Zenodo 2023] Zenodo garment worker job risk survey, 2,500 workers, November 2023 fieldwork, DOI 10.5281/zenodo.17117330, zero formal occupational safety training share, via bdpolicy.db series rmg_workforce_no_safety_training_pct, rmg_workforce_sample_size_nos.
[DTE 2023] Directorate of Technical Education, TVET Sector Performance Monitoring Framework 2021-2025 via ocr_text/dte_bd: public institute counts, manpower bureau technical training centres, monthly pay order subsidies, the 24 indicator KPI list and its statement that not all indicators carry targets.
[Planning Commission ADP 2025] Annual Development Programme 2025-2026, Programming Division, Bangladesh Planning Commission, June 2025, ADP at a glance sector table and ministry wise allocation table, shares on the 230,000.00 crore approved programme, Source link, accessed 6 September 2026. The same tag covers the revised FY2025-26 project table via bdpolicy.db adp_projects, education sector and agency allocations, committed costs, cumulative expenditure and named project lines in lakh taka converted to crore BDT, named as the revised programme wherever it is used.
[WB ES 2022] World Bank Enterprise Surveys, Bangladesh 2022 wave, series IC.FRM.TRNG.ZS, firms offering formal training, 2013 and 2022 waves, as cited in chapter 09.
[BMET 2023] Bureau of Manpower, Employment and Training, overseas employment statistics via bdpolicy.db, series bmet_overseas_employment_total, bmet_overseas_employment_skilled, bmet_overseas_employment_less_skilled, calendar year 2023, the series chapter 21 carries.
[UN WPP 2024] UN World Population Prospects 2024 via bdpolicy parquet, series un_wpp2024_bd medium variant, fertility and median age projected to 2036.