Protect coastal lives, livelihoods and assets
Bangladesh's coastal warning and shelter systems have helped reduce deaths, while homes, farmland and infrastructure remain exposed. EM-DAT recorded 18 storm deaths and about 4.59 million people affected in 2024 [EMDAT 2026]. Affected-person counts do not measure evacuation or asset losses, and outcomes vary with storm severity and track. Coastal policy needs to maintain preparedness while financing embankment maintenance, resilient livelihoods and relocation where protection is no longer viable.
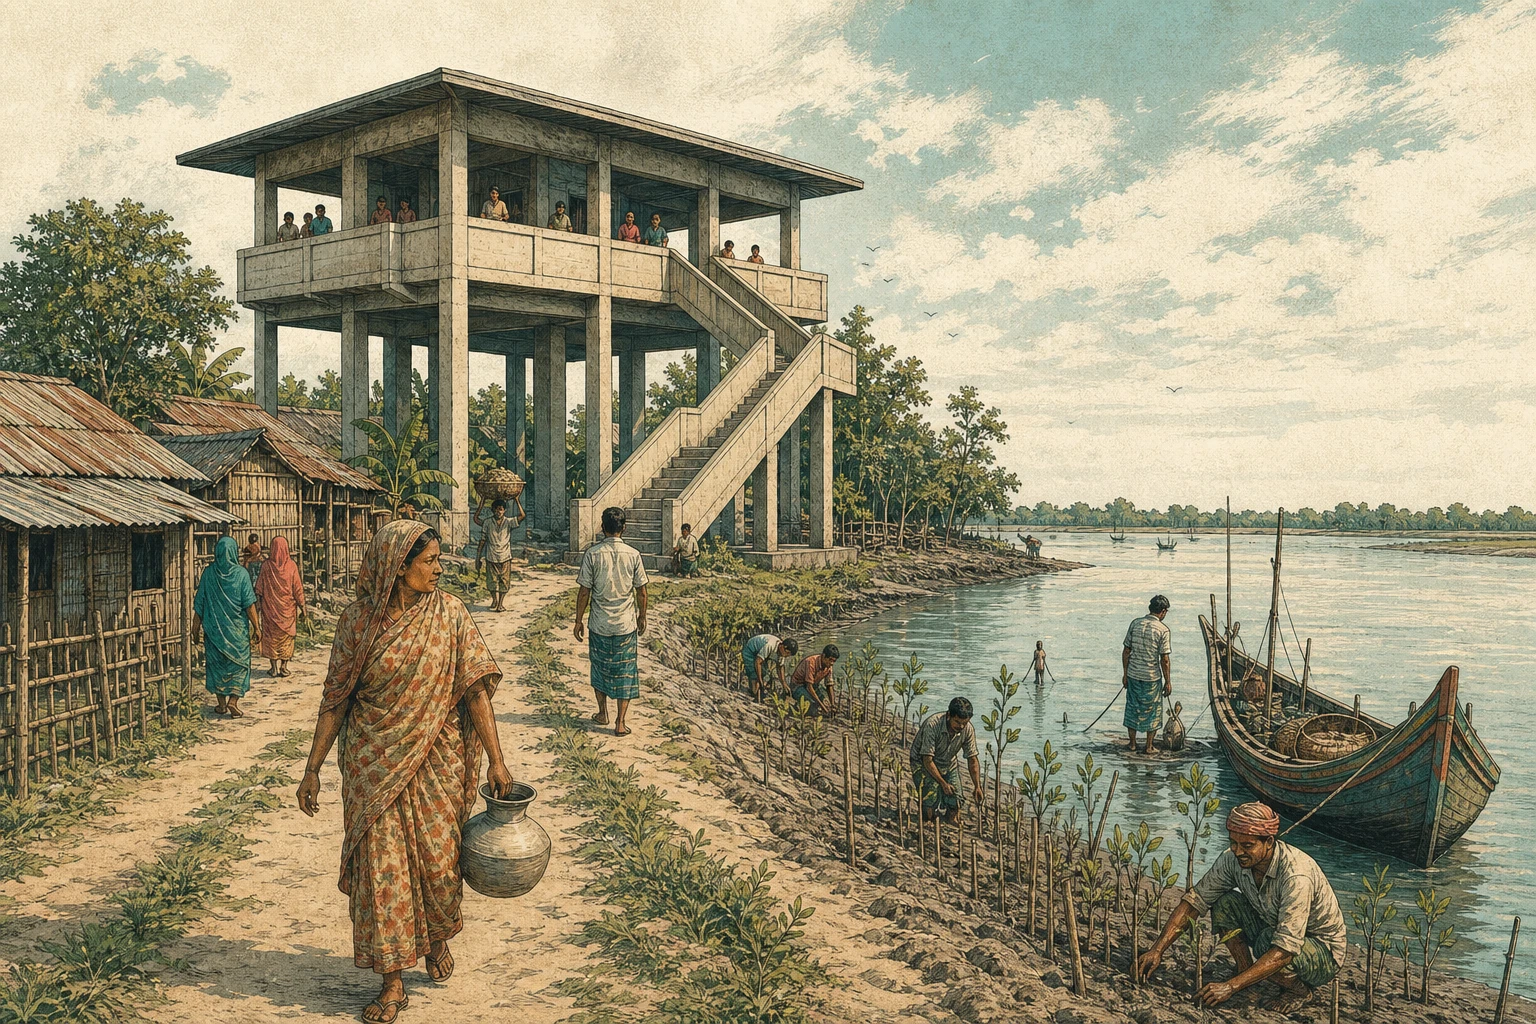
Storm impacts, embankments and coastal industries
The cyclone record is the strongest public performance statistic the state holds. EM-DAT logs 1 to 7 storm events a year across 2000 to 2025; the 2007 pair that included cyclone Sidr killed 4,275 people and affected 8,978,766, the 2009 pair that included Aila killed 197 and affected 3,954,550, and the single events of 2020, 2021 and 2022 killed 26, 3 and 35 [EMDAT 2026]. The recent years run at 16 deaths in 2023, 18 in 2024 and 13 in 2025 on 2 to 3 events a year, with 4,590,013 persons affected in 2024 against 10,104 in 2025, a swing that shows the affected count is storm track luck, not trend [EMDAT 2026].
Recorded damage reached 2,487.9 million USD in the 2020 Amphan year, against 3,748.2 million USD in 2007 and 4,602.0 million USD in 2004, and ran at 287.7 million USD in 2024 and 50.0 million USD in 2025 [EMDAT 2026]. The outside view agrees with the inside view: rank 31 of 174 with a score of 12.36 on the Germanwatch Climate Risk Index for 1993 to 2022, after rank 7 with a score of 28.33 in the assessment for 2000 to 2019 [Germanwatch CRI 2025] [Germanwatch CRI 2021]. The population in the water's way is the structural base: 8.38 percent of the population lived below 5 metres elevation at the series' 2015 reading [WB WDI 2026].
The protection stock is a century of engineering with no full renewal programme. The Water Development Board's FY20 inventory records 139 coastal polders holding 5,788 kilometres of coastal embankment inside a national embankment stock of 16,353 kilometres, operated through 15,488 hydraulic structures and 4,502 kilometres of drainage canal, with 1,413 closure dams and 5,737 bridges and culverts on the embankment lines [BWDB 2020]. The same inventory records the constructive side of the ledger, 1,045.81 square kilometres of land reclaimed and 31 district towns protected from river erosion behind 1,287 kilometres of bank protection works [BWDB 2020]. The flagship renewal effort, the World Bank financed Coastal Embankment Improvement Project phase 1, carries a committed cost of 3,280.00 crore BDT across six coastal districts and stood at 41.82 percent financial progress in the FY20 report, the reading chapter 28 cites for the water account [BWDB 2020].
Salinity is the slow hazard that converts the polder logic into a production problem, and it is now measured at the soil. The March 2024 in-situ survey of 162 GPS-tagged sites across the Satkhira, Khulna and Bagerhat belt, the survey chapter 11 introduced, found mean topsoil electrical conductivity of 1.52 millisiemens per centimetre with 29.63 percent of sites above the 2.0 agronomic threshold, split 24.07 slightly, 4.32 moderately and 1.23 highly saline [Zenodo 2024, DOI 10.5281/zenodo.14560019]. The drinking water fallback records the same belt at household level: Bagerhat households report 21.99 percent drinking surface water and 16.74 percent rainwater against 53.08 percent tube wells, and Satkhira 7.66 percent surface water, against a national pattern in which the tube well is the utility [BBS Census 2022, district drinking water tables].
The national extent of salinity intrusion in hectares still has no measured series in the cited sources, so any figure for it is not established, with the Soil Research and Development Institute and Water Development Board surveys the resolving sources, as chapter 11 records. River erosion, the other land loss channel, is likewise without an official displacement series; the 2,180-respondent riverside survey chapter 28 cites records 89.5 percent of respondents reporting that erosion in their reach has worsened or changed [Zenodo 2020, DOI 10.5281/zenodo.18255755].
The coastal economy behind the embankments is a set of export and subsistence industries that the mortality statistics never see. Shrimp and prawn production, the belt's main export crop, grew from 223,095 tonne in FY08 to 251,964 tonne in FY21, the last reading available to this chapter, with a dip to 186,418 tonne in FY10 [DoF 2021]. Marine fish production rose from 487,438 tonne in FY07 to 681,239 tonne in FY21 [DoF 2021]. The export outcome has moved the other way: frozen food exports, of which frozen shrimp is the main product, earned 422.28 million USD in FY23, down 20.76 percent from 532.94 million USD in FY22, 0.76 percent of total export earnings [EPB 2023].
Salt, the second coastal industry, expanded from 1.65 million tonne in FY21 to 1.83 in FY22 and 2.24 million tonne in FY23 [BSCIC 2023]. Tourism infrastructure on the coast remains a state corporation matter: 55 commercial tourism and hospitality units under the Parjatan Corporation at FY23 [Parjatan 2023], with private arrivals data not held in the cited sources and chapter 56's account pending. The mangrove that fronts all of it covered 801,700 hectares in FY23, 34.5 percent of Forest Department land [Forest Department 2023].
Preparedness, maintenance and displacement
The mortality mechanism is the one chapter 11 documented and the coast perfects: the Cyclone Preparedness Programme's volunteer network, the warning dissemination chain and the shelter system, coordinated under the Standing Orders on Disaster that assign warning, evacuation and shelter responsibilities down to the union level [MoDMR 2010], provide a framework for warning and evacuation. A comparative cost per life saved is not established by the sources cited here. The 2024 record reports 4,590,013 people affected and 18 deaths [EMDAT 2026]. It does not report how many people were evacuated or isolate the effects of preparedness from storm severity and track. Evacuation cannot protect fixed assets. Damage, livelihood loss and affected-person counts measure different consequences and should be reported separately.
The polder mechanism is the sediment trap chapter 11 and chapter 28 describe operating at national scale: embankments that cut the tidal sediment exchange starve and drain the land they protect, interior congestion raises water levels inside the line, and the protection stock becomes a maintenance treadmill. The FY20 inventory is the treadmill's asset register, 139 polders, 15,488 structures and 4,502 kilometres of drainage canal [BWDB 2020], and the improvement project at 41.82 percent after more than a decade is the treadmill's pace [BWDB 2020]. Salinity completes the mechanism from the inside: where polders keep fresh river water out, soil and water turn saline, the survey's 29.63 percent exceedance is the reading [Zenodo 2024, DOI 10.5281/zenodo.14560019], and households lose the tube well aquifer, the Bagerhat fallback shares show it [BBS Census 2022, district drinking water tables].
The coastal economy then adapts along the salinity gradient, shrimp replacing paddy, which chapter 16 carries into the national food account, and the same salinity that created the shrimp opportunity degrades the drinking water and the soil for everything else.
The displacement mechanism is the labour market exhaust of both. IOM's Displacement Tracking Matrix recorded 4,955,527 internally displaced persons nationwide at the October 2025 round, of which the three coastal divisions held 2,225,235, Barisal 594,628, Khulna 418,146 and Chattogram 1,212,461, a 44.9 percent share by this chapter's arithmetic, against 795,798 in Dhaka division as the destination reading [IOM DTM 2025]. The stock's composition by cause, storm and erosion displacement against economic relocation, is not split in the series and could not be confirmed, with the DTM methodology the resolving source; what the series does establish is that the coastal divisions hold the largest regional concentrations of displaced people in the country, but these regional stocks do not establish an origin-to-Dhaka migration flow.
The finance mechanism explains why the response is smaller than the exposure. Insurance penetration is 0.41 percent of GDP in 2023, the reading chapter 07 cites, a national premium-to-GDP measure that does not establish the insured share of coastal assets [IDRA 2024]; agricultural or index insurance for the shrimp and paddy belts has no measured book in the cited sources and could not be confirmed, with the insurance regulator the resolving source. Disaster finance is therefore the budget plus the donors: the disaster ministry's FY26 development allocation of 2,188.48 crore BDT across 10 projects, 0.95 percent of the 230,000.00 crore BDT programme the National Economic Council approved on 18 May 2025, the share as the programme prints it [Planning Commission ADP 2025], converts to about 178 million USD at the May 2026 rate of 122.75 taka per USD, and the humanitarian aid channel delivered 515.2 million USD in 2024, a flow that chapter 46 shows was rebuilt around the Rohingya response since 2017, when it stood at 56.0 million USD in 2015 and jumped to 253.6 million USD that year [OECD DAC 2024] [BIS 2026].
The relief tradition the Standing Orders institutionalise [MoDMR 2010] matches a relief budget; a capital stock of 139 polders does not.
Decisions on protection and resilient livelihoods
The named projections that frame the coastal FY27 to FY36 window are the World Bank's Country Climate and Development Report projections of climate losses, adaptation cost and internal migration, whose specific Bangladesh figures could not be confirmed from the cited sources, exactly as chapter 11 records, the published report being the resolving source [WB CCDR 2022]. Sea level scenarios for the Bay of Bengal and their local land loss translation are likewise not held in the cited sources, and no forecast is adopted here, with the panel literature and the Bangladesh Meteorological Department tide records the resolving sources.
The Delta Plan 2100 names the coastal zone among its hot spots and its investment and financing targets remain unpublished, the gap chapter 28 carries for the whole water account [GED Plans 2018]. What the verified record supports is the direction: the affected counts run into the millions in landfall years [EMDAT 2026], the salinity exceedance is measured at 29.63 percent on the soil [Zenodo 2024, DOI 10.5281/zenodo.14560019], and the displacement stock concentrates on the coast [IOM DTM 2025].
The polder decision, led by the Water Development Board with the Ministry of Water Resources, is whether the improvement project's successor phases are budgeted as a rolling maintenance programme or continue as one flagship at a time; the indicator to monitor is the water ministry's coastal rehabilitation share of its annual programme and the improvement project's completion status against its 3,280.00 crore BDT cost [Planning Commission ADP 2025] [BWDB 2020]. The shelter decision, led by the Ministry of Disaster Management and Relief, is whether the shelter stock is renewed before the warning machine outlives the hardware it serves.
The FY26 programme holds two shelter construction projects with a combined committed cost of 3,460.95 crore BDT, a disaster shelter project at 1,903.53 crore BDT of cost, 507.61 crore BDT spent and 26.7 percent progress, and a flood shelter project for flood prone and river erosion areas at 1,557.42 crore BDT of cost, 1,220.46 crore BDT spent and 78.4 percent progress; their combined FY26 allocation of 198.40 crore BDT is 5.7 percent of the committed cost, and the flagship preparedness project, the B-Strong DDM component, carries a 0.71 crore BDT allocation against a 244.14 crore BDT cost [Planning Commission ADP 2025].
The shelter stock count itself is not held in the cited sources and could not be confirmed, with the ministry the resolving source.
The coastal economy decision, led by the Department of Fisheries, the Export Promotion Bureau and the districts' salt and tourism boards, is whether the belt's industries convert from volume to compliance before the export window narrows: frozen food at 422.28 million USD and falling [EPB 2023] against shrimp production flat at a quarter million tonne [DoF 2021] is a value capture failure, not a biology failure, and the salt industry's 2.24 million tonne of FY23 [BSCIC 2023] sits one quality classification away from industrial users. The finance decision, led by the insurance regulator with the finance division, is whether the coast acquires a risk transfer layer before graduation thins the concessional windows chapter 02 dates to November 2026; the indicator to monitor is penetration off 0.41 percent of GDP and the first measured index insurance book [IDRA 2024].
The scenario this chapter assumes for chapter 15 is that the stall case keeps the disaster ministry near 1 percent of the development programme, nominal and shrinking in real terms, while the reform case raises the coastal protection and shelter shares and adds a risk transfer line, and the difference between those paths is measured in the polder failure record, not in the mortality record, which cannot be fixed in advance because storm exposure and preparedness both affect outcomes [EMDAT 2026].
Risks and opportunities
Risks. First, a polder failure at high tide: a landfall against a run down embankment line floods a protected basin, the scenario chapter 11 flags, and the indicators to monitor are the Water Development Board damage reports and recorded damage against the 4,602.0 million USD of 2004 [EMDAT 2026] [BWDB 2020]. Second, a shelter stock failure: the warning machine evacuates people into structures that fail, the arithmetic that turns a 198.40 crore BDT annual allocation against 3,460.95 crore BDT of committed shelter cost into a mortality number, and the indicators to monitor are the two shelter projects' completion status and storm deaths against the 13 of 2025 [Planning Commission ADP 2025] [EMDAT 2026].
Third, a coastal export collapse: frozen food leaves the export register as certification failures compound, the salinity belt loses its main cash crop, and the indicators to monitor are the frozen food series against 422.28 million USD and the shrimp production series against 251,964 tonne [EPB 2023] [DoF 2021].
Upside. First, the warning machine becomes an exportable institution: a country that moved millions with 18 deaths is the region's operating model for early warning, and the indicator to monitor is the standing orders framework's adoption in regional cooperation programmes [MoDMR 2010]. Second, the coast becomes insurable: index products for cyclone and salinity move the finance mechanism from ex post relief to ex post premium, the public stock gets a maintenance budget tied to a valuation, and the indicators to monitor are penetration off 0.41 percent of GDP and the first index book [IDRA 2024]. Third, the coastal economy converts value: shrimp at export grade compliance, salt at industrial grade and the mangrove front as a tourism and carbon asset reverse the frozen food decline, and the indicators to monitor are frozen food exports recovering toward the 532.94 million USD of FY22 and mangrove area holding at 801,700 hectares [EPB 2023] [DoF 2021] [Forest Department 2023].
Testing the policy case
The Water Development Board and disaster-management ministry should report maintenance, shelter functionality and losses relative to the hazards encountered. Low mortality after a mild season would not demonstrate that protection is complete. Repeated livelihood losses despite sound warning coverage would strengthen the case for adaptation or managed relocation.
What to watch
The thresholds below are author-proposed monitoring markers, not official targets or estimated policy effects. Interpret them alongside the source dates and definitions.
- Storm deaths. Latest cited value 13 in 2025, against the 4,275 of 2007 [EMDAT 2026]. Threshold: any year above 100 marks warning or shelter failure and reopens the mortality regime; a run of years below 50 would be consistent with the machinery holding through a landfall cycle.
- Storm affected persons. Latest cited value 4,590,013 in 2024, second to the 8,978,766 of 2007 [EMDAT 2026]. Threshold: a year above 9 million marks the big storm asset shock the finance stack cannot absorb; recorded damage above the 4,602.0 million USD of 2004 is the confirming reading.
- Shelter programme delivery. Latest cited value 198.40 crore BDT of FY26 allocation against 3,460.95 crore BDT of combined committed shelter cost, one project at 26.7 percent progress [Planning Commission ADP 2025]. Threshold: both projects completed before FY31, the horizon the improvement project's schedule assumed, marks the renewal regime; an allocation below 100 crore BDT a year would be consistent with the trickle.
- DAC humanitarian aid disbursements. Latest cited value 515.2 million USD in 2024, against 56.0 million USD in 2015 before the Rohingya response rebuilt the channel [OECD DAC 2024]. Threshold: a fall below 300 million USD as the chapter 46 caseload resolves would strip the disaster finance cushion; a carve out of the envelope for coastal disaster risk would mark the finance turn.
- Frozen food exports. Latest cited value 422.28 million USD in FY23, down 20.76 percent from 532.94 million USD in FY22, the latest annual report available to this chapter [EPB 2023]. Threshold: a fall below 300 million USD marks the coastal export regime failing; recovery above 532.94 million USD marks the value capture turn.
Sources used
[EMDAT 2026] EM-DAT Emergency Events Database, UCLouvain, Bangladesh storm and total disaster series via bdpolicy.db, series: emdat_storm_deaths_total, emdat_storm_events_total, emdat_storm_affected_total, emdat_disaster_damage, 2000 to 2025.
[Germanwatch CRI 2025] Germanwatch Climate Risk Index 2025, Table 5, Bangladesh rank 31 of 174 and score 12.36 for 1993 to 2022.
[Germanwatch CRI 2021] Germanwatch Climate Risk Index 2021, Bangladesh rank 7 and score 28.33 for 2000 to 2019, via the climate/germanwatch_cri_bd parquet.
[WB WDI 2026] World Bank World Development Indicators via the climate/wb_environment_bd_deep parquet, series: EN.POP.EL5M.ZS population below 5 metres elevation, 2015 reading.
[BWDB 2020] Bangladesh Water Development Board annual report FY2019-20 via ocr_text/bwdb_deep, polder and embankment inventory, hydraulic structures, drainage canals, land reclamation, bank protection, and the Coastal Embankment Improvement Project phase 1 cost and progress.
[Forest Department 2023] Bangladesh Forest Department, forest land by type FY2022-23, mangrove area and share, via bdpolicy.db series forest_area_mangrove_ha, forest_area_total_ha, reused from chapter 11.
[Zenodo 2024] Bangladesh coastal soil salinity in-situ survey, 162 GPS-tagged sites, Satkhira, Khulna and Bagerhat belt, March 2024, MIT/WECG Laboratory sampling, SRDI salinity classes, DOI 10.5281/zenodo.14560019, via bdpolicy.db series coastal_soil_salinity_*.
[BBS Census 2022] Bangladesh Bureau of Statistics, Population and Housing Census 2022, district drinking water source tables via the lake/water_sanitation parquet, Bagerhat, Satkhira and Khulna readings.
[Zenodo 2020] Zenodo riverbank erosion and flood perception survey, 2,180 riverside respondents, DOI 10.5281/zenodo.18255755, via bdpolicy.db series erosion_perception_worsened_pct, reused from chapter 28.
[DoF 2021] Department of Fisheries, Ministry of Fisheries and Livestock, fish and shrimp production statistics via bdpolicy.db, series: dof_shrimp_prawn_production, dof_fish_marine_production, FY07 to FY21.
[EPB 2023] Export Promotion Bureau, annual report 2022-23 via ocr_text/epb_deep, frozen food sector export earnings FY22 and FY23, share of total exports and sector description.
[BSCIC 2023] Bangladesh Small and Cottage Industries Corporation, national salt production via the MoF SOE evaluation tables in bdpolicy.db, series: bscic_salt_production_million_mt, FY21 to FY23.
[Parjatan 2023] Bangladesh Parjatan Corporation, commercial tourism and hospitality units via the MoF SOE evaluation tables in bdpolicy.db, series: parjatan_total_tourism_units_nos, FY23.
[MoDMR 2010] Ministry of Disaster Management and Relief, Standing Orders on Disaster 2010 via ocr_text/govtwin_min_disaster, institutional assignment of warning, evacuation and shelter responsibilities; the Department of Disaster Management annual report via ocr_text/ddm.
[IOM DTM 2025] IOM Displacement Tracking Matrix via HDX HAPI tables in bdpolicy.db, series: hapi_idps_total_displaced_persons, hapi_idps_div_barisal_displaced_persons, hapi_idps_div_khulna_displaced_persons, hapi_idps_div_chittagong_displaced_persons, hapi_idps_div_dhaka_displaced_persons, October 2025 round.
[IDRA 2024] Insurance Development and Regulatory Authority, annual report 2023-24, insurance penetration, reused from chapter 07.
[Planning Commission ADP 2025] Annual Development Programme 2025-2026, Programming Division, Bangladesh Planning Commission, June 2025, ministry wise allocation table, disaster and water ministry lines in crore BDT with shares on the 230,000.00 crore programme approved by the National Economic Council on 18 May 2025 (238,695.64 crore including own funds of autonomous bodies),
[OECD DAC 2024] OECD Development Assistance Committee, DAC Members humanitarian aid disbursements to Bangladesh, current USD millions, via the aid/oecd_dac2a_bd parquet, 2013 to 2024.
[BIS 2026] Bank for International Settlements, USD/BDT exchange rate via bdpolicy.db series bis_usd_bdt_monthly_eop, May 2026 reading of 122.75.
[WB CCDR 2022] World Bank Bangladesh Country Climate and Development Report, resolving source for climate loss, adaptation financing and internal migration projections, figures not held in the cited sources.
[GED Plans 2018] General Economics Division, Bangladesh Delta Plan 2100, coastal zone framework quoted, investment and financing targets not held in the cited sources.