Chapter 53 of 60 in the Bangladesh 2036 research base. Contents of the series.
Credible statistics require visible methods
Revisions are a normal part of economic statistics; their credibility depends on whether users can understand what changed and why. Bangladesh’s revised national accounts, census checks and quarterly estimates offer material for that assessment. The priority is a published revision history, comparable time periods and transparent methods, rather than an expectation that different price indices must agree.

Revisions, population counts and price indices
The revision record is the sharpest new fact and it comes from BBS's own estimate documents. The FY24 provisional estimate, compiled on partial year data, put growth at 5.82 percent [BBS NA 2024]; the final accounts cut it to 4.22 percent [BBS NA 2025, FY25 final estimate]. The revision concentrated where the old regime's numbers were most questioned: industrial growth fell from a provisional 6.66 percent to a final 3.51 percent, and nominal GDP for FY24 fell from 5,048,027 crore BDT to 5,002,654 crore BDT, a cut of 45,373 crore BDT, about 0.9 percent of the level [BBS NA 2024] [BBS NA 2025, FY25 final estimate].
Per capita income moved with it, from a provisional 306,144 taka to a final 304,102 taka for FY24 [BBS NA 2024]. The FY25 provisional estimate carries the compilation note that dates it: a nine month July to March average exchange rate of 120.29 taka per USD, so the first provisional print lands with a quarter of the year unobserved [BBS NA 2025, FY25 provisional estimate, compilation note]. The FY25 revision repeated the direction on a smaller scale: growth from 3.97 to 3.49 percent, industrial growth from 4.34 to 3.71 percent, nominal GDP from 5,552,753 crore BDT to 5,515,026 crore BDT, and per capita GNI from 339,211 taka to 334,511 taka, 2,820 to 2,769 USD [BBS NA 2025, FY25 provisional and final estimates].
Two consecutive downward revisions inside one institutional reset are either an honesty dividend or a volatility problem; which is the first what to watch indicator.
The level record shows what the revisions do to the numbers the outside world quotes. Per capita GNI in USD fell from 2,749 USD in FY23 to 2,738 USD in FY24 and recovered to 2,769 USD in FY25: nominal taka growth of 10 to 11 percent a year [BBS NA 2025, FY25 final estimate] was absorbed by the average exchange rate moving from 99.46 to 111.06 to 120.82 taka per USD [BBS NA 2025, FY25 final estimate, per capita income table]. The dollar level of GDP went sideways through the entire depreciation: 452 billion USD in FY23, 450 billion USD in FY24, 456 billion USD in FY25 [BBS NA 2025, FY25 provisional and final estimates].
The joint between the production and expenditure sides of the same accounts is published and wide: the statistical discrepancy line ran at plus 1.19 percent of GDP in FY22 and minus 0.52, minus 0.89 and minus 0.84 percent in FY23, FY24 and FY25 [BBS NA 2025, FY25 final estimate, Table 9]. The deflator is the other judgement every real number rides on: the GDP deflator ran 6.89, 6.88 and 6.53 percent a year across FY23 to FY25 on the final estimate vintage [BBS NA 2025, FY25 final estimate, Table 7] while national CPI inflation printed 9.02 percent in FY23 [BBS CPI 2023], 9.86 percent in January 2024 [BBS CPI 2024] and 8.77 percent in calendar 2025 [WB WDI 2026].
A consumer index running roughly 2 points above the economy wide deflator means the real growth print depends entirely on sector deflators, and that wedge is measurable every year, which is the second what to watch indicator.
The census is the counter example. The 2022 census enumerated 165,158,616 people, then did what statistical offices are supposed to do and few do publicly: it ran a post enumeration check, measured a net coverage error of 2.75 percent, and published an adjusted population of 169,828,911, adding 4.67 million people to its own count [BBS Census 2022, post enumeration check tables]. The error was not uniform: 3.19 percent urban against 2.55 percent rural, 2.81 percent for men against 2.69 percent for women, 4.23 percent for children aged 0 to 4, and a division spread from 3.33 percent in Sylhet down to 2.12 percent in Rajshahi [BBS Census 2022, post enumeration check tables].
The adjusted count exposes a denominator question the official documents leave open: the national accounts use population estimates of 171.30 million in FY22 falling to 170.84 million in FY23, then 171.59 million in FY24 and 172.85 million in FY25 [BBS NA 2025, FY25 provisional estimate, Table 8], every annual figure above the census adjusted total, while the IMF world outlook pull this chapter draws on places 2025 population at 175.69 million [IMF WEO 2026]. Spreading the same final per capita GNI of 334,511 taka over the IMF denominator gives about 329,100 taka, so per capita income claims move 1.6 percent on a denominator choice; the census is the only instrument both estimates claim to respect.
The price index finally moved base, a decade late. The CPI panel available to this chapter shows every monthly print through March 2023 on the 2005-06 base and every print from January 2024 on the 2021-22 base, with FY23 re referenced to the new base at 9.02 percent [BBS CPI 2024] [BBS CPI 2023]. Rebasing changes the basket weights and should be accompanied by published methods and a linked historical series. The new base was already in use before the 2024 political transition; it should not be attributed to that transition.
The weights are in no document available to this chapter, so this chapter does not assess the basket composition behind the inflation measures, with BBS's CPI sources and methods publication as the resolving source. The labour force survey ran full rounds in 2013, 2015-16, 2016-17 and 2022, the microdata panel available to this chapter holds exactly those four vintages, and the quarterly labour force bulletin series the registry records began only in 2023 [BBS LFS 2023]. The household income survey runs on roughly a six year cadence with 2022 the latest round [BBS HIES 2022].
The consequence is measured in chapter 08 and restated here as a statistics fact before a labour fact: the census puts youth not in employment, education or training at 35.44 percent of the 15 to 24 population, the unweighted mean of 64 district level rates rather than a population weighted national figure, ranging from 25.44 percent in Dhaka to 42.16 percent in Lakshmipur [BBS Census 2022, census district youth NEET table], against a national, survey based estimate of 14.96 percent for the same year 2022, rising to 15.43 percent in 2024 [WB WDI 2026], and informal employment is 84.9 percent of the 2022 total on the national instrument [BBS LFS 2022], a number four years stale before its next full round.
The World Bank Statistical Performance Indicators, the standard capacity benchmark, are not available to this chapter, so the institutional rating this research base can verify is the CPIA transparency score, 3.0 in 2010 and 2.5 of 6 in every assessment from 2011 through 2024 [WB CPIA 2024], next to the Open Budget transparency score of 37 of 100 chapter 12 carries [IBP Open Budget 2023].
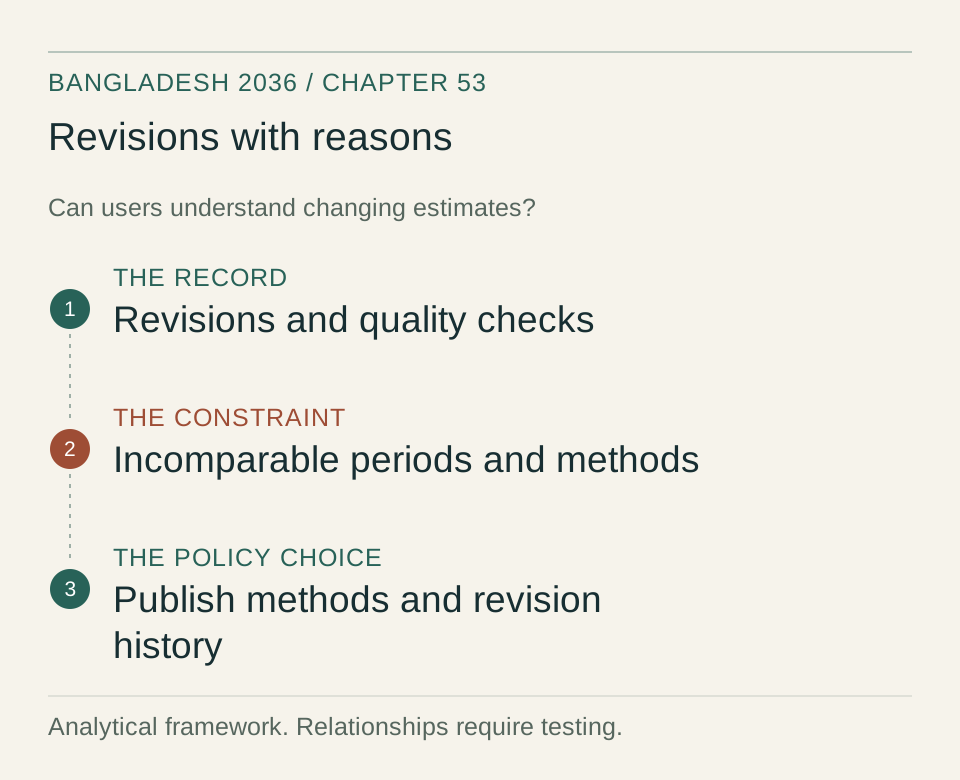
How estimates are constructed and checked
The first mechanism is the deflator judgement at the centre of the growth record. Real growth is calculated by dividing the nominal growth factor by the relevant deflator growth factor; subtraction is only an approximation, and the GDP deflator and consumer price index measure different baskets. Their difference is not, by itself, evidence of overstated real growth. The published deflator ran 6.89 percent in FY23, 6.88 in FY24 and 6.53 in FY25 on the final estimate vintage, easing rather than rising, while the consumer index printed 9.02 percent in FY23 and 8.77 percent in calendar 2025 [BBS NA 2025, FY25 final estimate, Table 7] [WB WDI 2026].
The revisions do not identify how much change came from deflators rather than revised output estimates. Industrial growth lost 3.15 percentage points between the FY24 provisional and final vintages [BBS NA 2024] [BBS NA 2025, FY25 final estimate]. Assessment requires published deflator methods and matched time periods. A narrowing difference from CPI is not a standalone test of national-account quality.
The second mechanism is an architecture built for a decade long plan rather than a monthly economy. BBS has estimated and published Quarterly GDP every quarter since Q1 FY2023-24, backcast to FY2015-16 using the approved annual GDP series, and on the production side only even though the annual accounts are compiled on both the production and expenditure sides [BBS NA 2026, QGDP FY26 Q1 release]. The specific government decision that authorised the series and the extent of IMF involvement in launching it could not be confirmed from the cited reports; BBS's QGDP methodology note and the IMF programme review documents would resolve them.
The backcast exposes why the quarterly matters: the same annual series that prints 3.45 percent for FY20 contains a fourth quarter of minus 7.72 percent, and the 6.94 percent FY21 contains a fourth quarter print of plus 21.59 percent [BBS NA 2025, backcast panel], base effects an annual average hides and a policymaker cannot see. The survey system inherits the same planning rhythm: a labour force survey every three or four years at best, an income survey every six, so the informal economy, participation rate and distribution that chapters 08, 22 and 34 depend on are measured on instruments years old between rounds.
The published revision machinery is the one part that moved to international practice: the second quarter FY25 release restates the first quarter figure from 1.81 to 1.96 percent and cites the IMF Quarterly National Accounts Manual revision policy as the authority [BBS NA 2025, QGDP FY25 Q2 release], and the first quarter FY26 release carries the benchmarked restatement, Q1 FY25 at 2.58 percent, with the FY25 quarterly aggregate at 3.72 percent against the annual production side estimate of 3.49 [BBS NA 2026, QGDP FY26 Q1 release]. A statistics office that publishes its own revisions with a named methodology is doing the one thing the credibility discount says it cannot.
The third mechanism is the census, which works because its quality control is external to the enumeration and published with it. The 2.75 percent net coverage error and its adjustment to 169,828,911 [BBS Census 2022, post enumeration check tables] is the template the rest of the system lacks: an independent recheck, a measured error, a published correction. Every downstream number inherits the census: per capita income, the poverty maps, the constituency rolls; the accounts population estimates sitting above the census adjusted total [BBS NA 2025, FY25 provisional estimate, Table 8] show the interpolation problem the next inter-census decade carries. The IMF denominator gap of 2.84 million people [IMF WEO 2026] is not fraud, it is two institutions interpolating differently from the same anchor, the class of gap a functioning statistics system publishes so outsiders do not have to guess.
The fourth mechanism is the reset itself. Chapter 12 records the transition's institutional corrections and names the statistics rebuild as the third clock of the decade; the correction reached the numbers within two vintages. The FY24 and FY25 downward revisions, the rebased CPI, the quarterly benchmarking under a published IMF methodology and the census check are all transition era facts [BBS NA 2025] [BBS Census 2022] [BBS CPI 2024]. The mechanism that made them possible is chapter 12's: the incentive to overprint fell out of the system when the government that consumed the flattering numbers fell.
What the mechanism cannot supply is durability. A revision policy that depends on the temperament of an interim administration is not a regime, and the legal question, whether the statistics law gives the bureau independence, a publication calendar immune to clearance and protection for staff who publish unflattering numbers, is unresolved in the cited reports; the statistics act's status could not be confirmed, the Statistics and Informatics Division the resolving source. The bureau's budget line is likewise not available to this chapter, so what a credible system costs could not be confirmed; the Finance Division budget documents would resolve it; what it delivers is measurable, and listed in the what to watch section.
Decisions on methods and publication
The revision regime is the first decision and BBS with the Statistics and Informatics Division owns it. The record now holds two revision pairs, minus 1.60 percentage points for FY24 and minus 0.48 for FY25 [BBS NA 2024] [BBS NA 2025, FY25 provisional and final estimates]. The decision is whether the revision history becomes a published series with back data, the practice the IMF manual the bureau cites requires [BBS NA 2025, QGDP FY25 Q2 release], or reverts to silent overwriting. The chapter 15 scenarios split: the reform scenario assumes the provisional to final revision error stays under half a percentage point as the partial year estimation improves; the stall scenario assumes revisions revert to one direction or to silence.
The base year cycle is the second decision. The national accounts base of 2015-16 sat ten fiscal years behind the accounts at FY26, and the CPI base of 2021-22 begins drifting the day it ages past its weights [BBS CPI 2024]. The decision is a scheduled rebasing of the accounts onto the next supply use benchmark with the weights published, and a CPI weights release that lets outsiders recompute the basket. An old base is a stale structure deflating a new economy; on it rides whether the deflator wedge of the mechanism section can ever close. The reform scenario assumes the accounts rebase and the CPI weights publication happen inside the cycle the IMF programme reviews monitor; the stall scenario assumes the 2015-16 base is patched with turnover updates for another decade, the pattern that produced the previous gap.
The quarterly architecture is the third decision and its author is also BBS, the IMF programme the external monitor, the advice that created the quarterly accounts on the record [BBS NA 2025, QGDP releases]. Production side only, unadjusted for seasonality, benchmarked annually, the quarterly series already answers the question the annual number cannot [BBS NA 2025, backcast panel]. The decision is the expenditure side, a quarterly investment and consumption read to match the savings ratios the annual accounts publish a year late. The reform scenario assumes the expenditure side enters publication inside the decade; the stall scenario assumes the production side series stays the whole quarterly offer.
The legal and budgetary settlement is the fourth decision and its authors are the thirteenth parliament chapter 12 documents and the Finance Division. The statistics act question, the publication calendar, the bureau's budget and staffing are all not confirmed in the cited reports, the division and the parliament the resolving sources, which is itself the finding: the framework document of the institution whose output this research base runs on is absent from its public record, while the procurement rulebook rewrite [BPPA 2025] and the central bank law chapter 05 references each got their own settlement.
The reform scenario assumes a statistics law with an independent publication authority and a budget line, and the CPIA transparency rating moving off 2.5 toward the 3.0 chapter 12 targets by the assessment cycle the early 2030s window covers [WB CPIA 2024]; the stall scenario assumes the bureau keeps producing honest numbers on institutional goodwill alone, which a hostile successor government can end at zero cost.
How to test the argument. BBS and the Statistics and Informatics Division should publish revision explanations, matched-period comparisons and release histories. If users cannot reproduce an estimate or explain a revision from those materials, a small statistical discrepancy alone cannot establish credibility.
Risks and opportunities
Risks. First, revision suspicion re entrenches: the two downward revisions get read not as honesty but as evidence that any vintage can move half a point or more, every contract written on provisional numbers reprices, and monitor the revision error series, where a third consecutive revision above 1 percentage point confirms a structural rather than transitional problem [BBS NA 2024]. Second, the survey calendar slips: the quarterly labour force bulletins thin out or the next income survey rounds late, and the numbers chapters 08, 22 and 34 run on age into guesswork while the 2022 census anchors drift past their use by date; monitor the bulletin cadence against the registry's quarterly record [BBS LFS 2023].
Third, the deflator wedge widens: if inflation stays near 9 percent while the deflator runs near 6.5 [WB WDI 2026] [BBS NA 2025, FY25 final estimate, Table 7], every real growth print becomes an arithmetic artefact of sector price assumptions, and monitor the wedge itself crossing 4 points in the direction that flatters growth.
Upside. First, the credibility premium: the measurement dividend chapter 12 names is financeable, and a statistics office with a published revision record and a current base gives the sovereign spread series in chapter 07 one fewer discount to carry; monitor the revision error series holding under half a point. Second, the census method generalises: the post enumeration check is a product the bureau can attach to every major survey, and an income survey published with a measured coverage error moves the poverty numbers chapters 01 and 34 run on from estimates to measurements; monitor the next HIES shipping with a check report [BBS HIES 2022].
Third, the quarterly series becomes decision infrastructure: bank supervision in chapter 06, the subsidy arithmetic in chapter 04 and the inflation targeting chapter 05 prices all run faster on a quarterly economy than an annual one, and monitor the expenditure side release entering the publication calendar.
Statistical-quality indicators to follow
The benchmarks below are author-proposed monitoring points, not validated causal cutoffs or official forecasts.
- Provisional to final GDP growth revision error. Current values: minus 1.60 percentage points for FY24, minus 0.48 for FY25 [BBS NA 2024] [BBS NA 2025, FY25 provisional and final estimates]. Proposed benchmark: two consecutive years inside 0.5 points absolute may indicate the credible vintage regime; a third consecutive revision above 1 point may indicate systematic misestimation and reopens the discount.
- The GDP deflator to CPI wedge. Current values: deflator up 6.53 percent in FY25 on the final estimate against CPI inflation of 8.77 percent in calendar 2025, an arithmetic difference of 2.24 points between different time periods, which is not a comparable annual inflation gap [BBS NA 2025, FY25 final estimate, Table 7] [WB WDI 2026]. Proposed benchmark: a comparable-period difference should be explained through basket weights and methods; no one-point cutoff validates a deflator; a large unexplained difference on a matched-period basis in the growth flattering direction makes every real print an artefact and is the stall marker.
- The statistical discrepancy between the production and expenditure accounts. Current value: minus 0.84 percent of GDP in FY25, against a band of plus 1.19 to minus 0.89 percent across FY22 to FY25 [BBS NA 2025, FY25 final estimate, Table 9]. Proposed benchmark: a discrepancy held inside half a point both directions is the normal band; a breach of 1.5 points would indicate the two methods diverging and the accounts losing their internal check.
- CPIA transparency rating. Current value 2.5 of 6, unchanged since 2011 [WB CPIA 2024]. Proposed benchmark: a move to 3.0 or better in two consecutive assessments, the pattern chapter 12 sets for the capacity ratings, is the statistics regime change; a fifth cycle at 2.5 is the publication ceiling confirmed.
- Labour statistics cadence. Current status: quarterly bulletins recorded since 2023 [BBS LFS 2023] against a full survey stock ending with the 2022 round [BBS LFS 2022]. Proposed benchmark: four consecutive quarters of published bulletins with microdata through the electoral cycle mark the labour statistics regime; a missed annual round or a second silent quarter reopens the survey census fog chapter 08 measures.
Sources
[BBS NA 2024] BBS national accounts, provisional estimate of FY24 GDP: growth 5.82 percent, industry 6.66 percent, nominal GDP 5,048,027 crore BDT, per capita income 306,144 taka, nine month average exchange rate note, via ocr_text/bbs_macro/gdp_2023_24_provisional.
[BBS NA 2025] BBS national accounts, FY25 provisional and final estimates, FY24 final estimate and quarterly GDP releases: FY25 growth 3.97 provisional and 3.49 final, FY24 final 4.22, FY23 final 5.78, sector revisions, nominal GDP and per capita GNI by vintage, population table, statistical discrepancy, final estimate GDP deflator (Table 7), exchange rate table, quarterly GDP production side only with backcast 2015-16 to 2022-23, Q1 FY25 first print 1.81 restated to 1.96 in the Q2 release under the revision policy of the IMF Quarterly National Accounts Manual 2017, via ocr_text/bbs_macro/gdp_2024_25_provisional, ocr_text/bbs_main and lake/macro/bbs_qgdp_bd.
[BBS NA 2026] BBS quarterly GDP, first quarter FY26 release, July to September 2025: growth 4.50 percent, Q1 FY25 restated to 2.58 percent, FY25 quarterly aggregate 3.72 percent, via ocr_text/bbs_main.
[BBS CPI 2023] BBS CPI, national annual averages, FY23 inflation 9.02 percent, from chapters 01 and 05.
[BBS CPI 2024] BBS CPI monthly panels: national CPI 9.86 percent in January 2024, base year change from 2005-06 to 2021-22 between the March 2023 and January 2024 monthly prints, via lake/prices/bbs_cpi_monthly_sector_panel and bbs_cpi_historical_annual_panel.
[BBS Census 2022] Population and Housing Census 2022, post enumeration check tables: enumerated 165,158,616, net coverage error 2.75 percent, adjusted population 169,828,911, errors by location, sex, age and division, via ocr_text/census2022_thematic/pec_adjusted_population_2022.
[BBS LFS 2022] BBS Labour Force Survey 2022 round, informal employment rate 84.9 percent, from chapter 08.
[BBS LFS 2023] BBS quarterly labour force bulletin series recorded from 2023, registry cadence entry, and the four vintage microdata panel 2013, 2015-16, 2016-17 and 2022 via lake/bbs_lfs_aie_panel.
[BBS HIES 2022] Household Income and Expenditure Survey 2022, latest round on a roughly six year cadence, from chapters 01 and 08.
[WB CPIA 2024] World Bank Country Policy and Institutional Assessment, transparency rating 3.0 in 2010 and 2.5 from 2011 through 2024, via bdpolicy parquet governance/wb_cpia_bd, series IQ.CPA.TRAN.XQ.
[IBP Open Budget 2023] International Budget Partnership, Open Budget Survey 2023, Bangladesh country results: transparency 37, participation 11, legislative oversight 33 and audit oversight 45, each out of 100. The survey assesses material through 31 December 2022. Country results, checked 7 September 2026.
[WB WDI 2026] World Bank World Development Indicators: CPI inflation (FP.CPI.TOTL.ZG) 8.77 percent in calendar 2025, youth NEET (SL.UEM.NEET.ME.ZS) 14.96 percent in 2022 and 15.43 percent in 2024, via indicators/wb_full_bd.parquet; the bdpolicy.db sqlite series wb_cpi_inflation, wb_sl_uem_neet_zs and hdx_wb_sl.uem.neet.me.zs hold 0 rows.
[IMF WEO 2026] IMF World Economic Outlook pull, population 175.69 million in 2025, via lake/macro/macro_gdp_projections_bd.
[BPPA 2025] Public procurement rulebook rewrite effective 28 September 2025, from chapter 12, as the comparison point for institutional settlements.