Chapter 34 of 60 in the Bangladesh 2036 research base. Contents of the series.
Social protection that holds its value
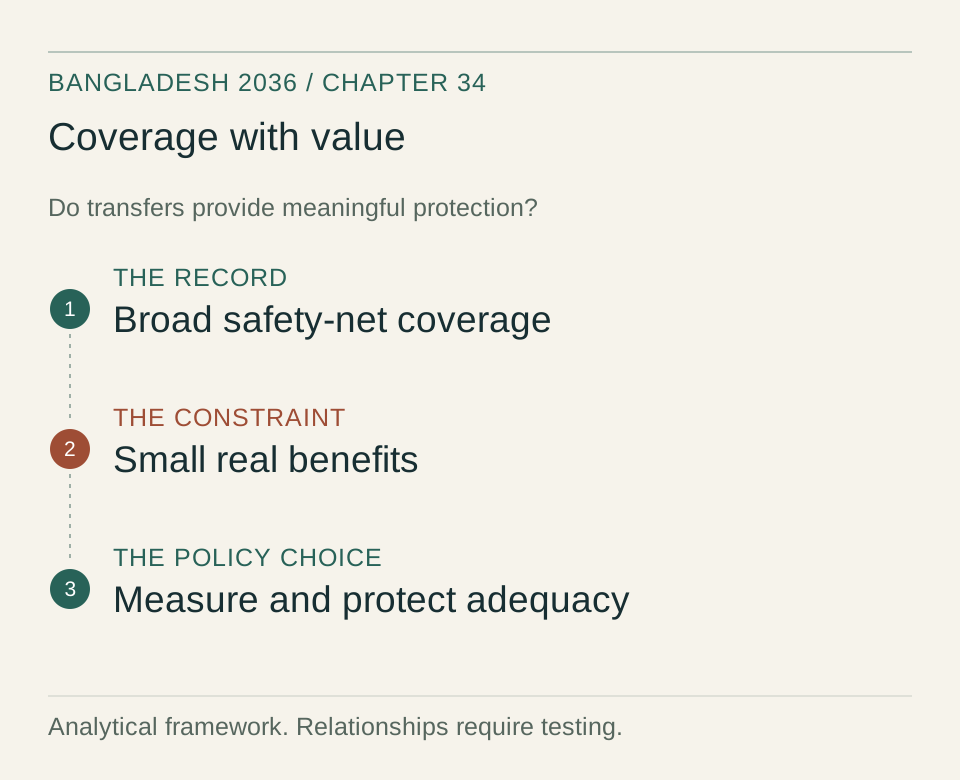
Bangladesh’s poverty reduction record is substantial, but coverage alone does not show whether social protection offers meaningful support. Small transfers lose purchasing power when prices rise, and contributory insurance reaches few households. Better targeting needs to be matched by adequate benefits, regular household evidence and a clear plan for ageing.
Poverty and inequality
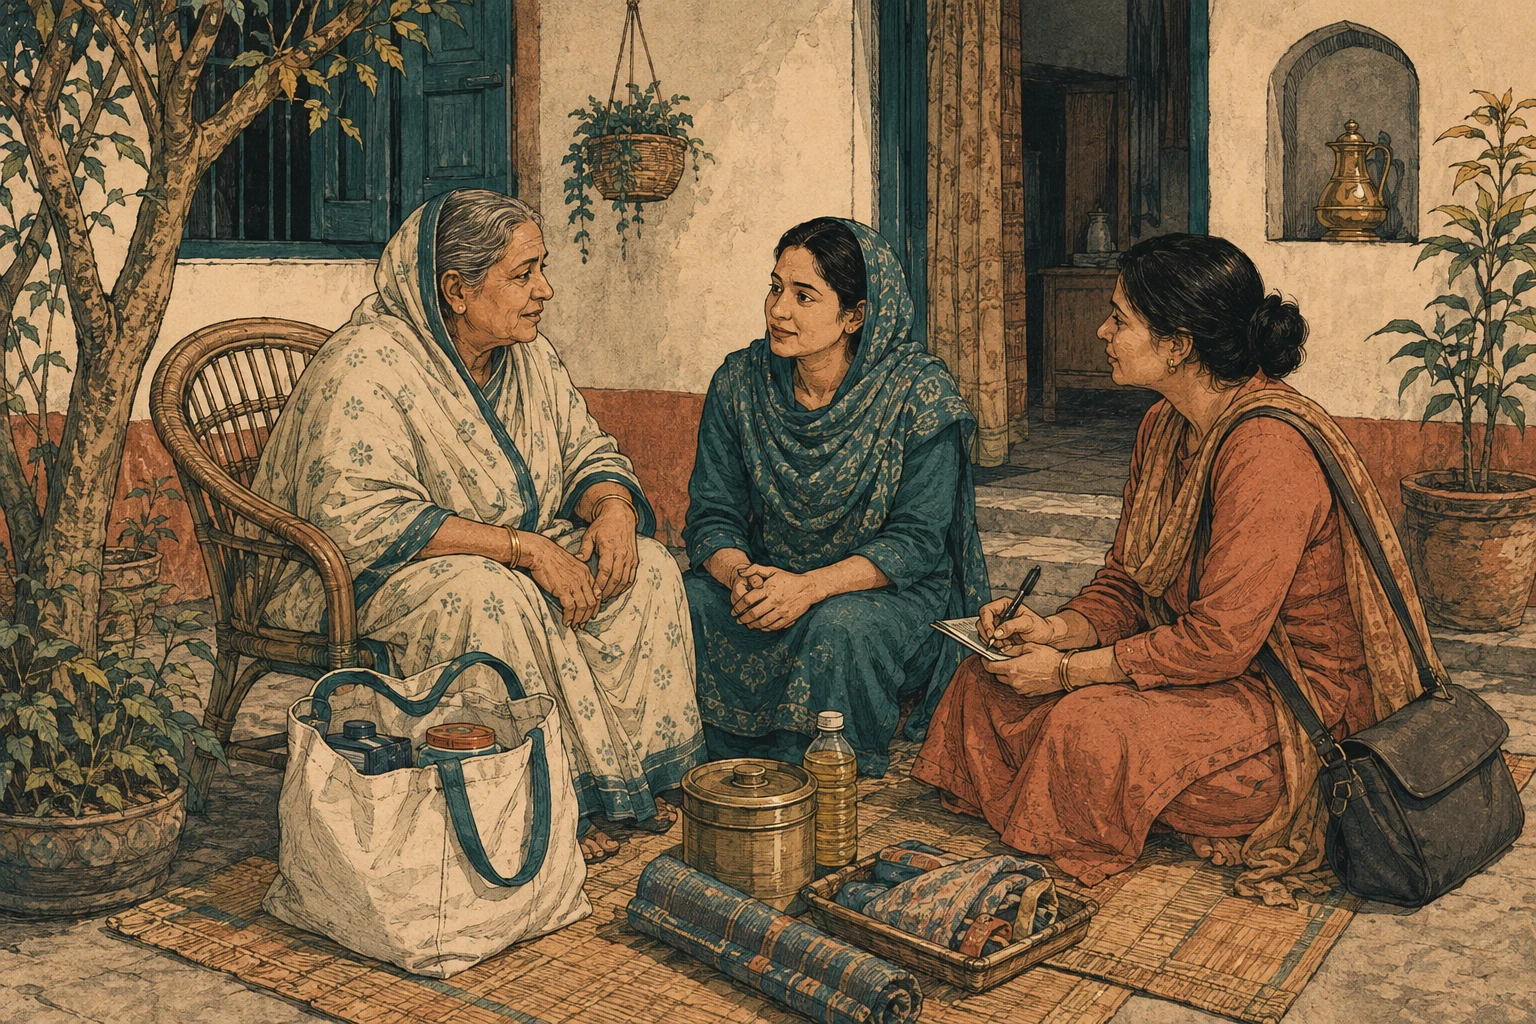
The poverty record is long, fast and recent. On the national upper line, the headcount fell from 48.9 percent in 2000 to 40.0 in 2005, 31.5 in 2010, 24.3 in 2016 and 18.7 percent in 2022 [BBS HIES 2022]. On the lower line, the extreme poverty rate fell from 34.3 percent in 2000 to 17.6 in 2010, 12.9 in 2016 and 5.6 percent in 2022 [BBS HIES 2022]. Rural upper poverty fell from 35.2 percent in 2010 to 20.5 percent in 2022, urban poverty from 21.3 to 14.7 percent [BBS HIES 2022]; the divisional convergence, chapter 14's and chapter 49's finding, was purchased by spatially generic assets and remittances, not by a regional policy.
On the international lines the same record reads as depth: the share below 3.00 international dollars a day fell from 25.1 percent in 2010 to 5.9 percent in 2022, the share below the 4.20 dollar line from 52.1 to 20.5 percent, and 58.0 percent remained below the 6.85 dollar line in 2022 [WB WDI 2022, headcount at the 6.85 dollar line]. That last number is the decade's real constituency: of every six people who were poor in 2000, five have crossed the extreme line, and most of them sit one hospital admission, one flood or one rice price spike above the line they just crossed.
The multidimensional record confirms the flow poverty but dates the stock. The national multidimensional poverty index fell from 0.145 in the 2014 Demographic and Health Survey round to 0.073 in the 2019 MICS round and 0.050 in the 2022 DHS round, with the headcount down from 30.52 to 16.45 to 11.51 percent and severe poverty down from 10.99 to 2.62 percent [OPHI MPI 2024, national series, DHS 2014, MICS 2019 and DHS 2022 waves]. Chapter 49 carries the divisional split and its money poverty versus service deprivation finding. The working poor complete the flow picture: the modelled working poverty rate stood at 4.90 percent in the latest reading, down from 5.33 percent [ILO 2026, indicators snapshot 2026-09-04]. The 84.0 percent informality share chapter 08 measures for 2024 [ILO 2025] is why the lift arrives as a wage flow, not as a contract with insurance attached.
Inequality moved the other way, and the two Ginis tell the decade's distribution story. The HIES income Gini rose from 0.458 in 2010 to 0.482 in 2016 and 0.499 in 2022, with the urban Gini at 0.539 and the rural Gini at 0.446, an urban led deterioration chapter 14 locates in the land and housing market [BBS HIES 2022]. The income shares are starker: the top decile held 40.92 percent of income in 2022 against 38.09 percent in 2016, the top five percent 30.04 against 27.82 percent, while the bottom five percent held 0.37 percent against 0.23 percent [BBS HIES 2022].
On the consumption distribution the World Bank series moves the other way, a Gini of 30.9 in 2022 against 32.1 in 2010 [WB WDI 2026], and the top decile's consumption share fell to 25.47 percent from 26.92 percent [WB WDI 2022, decile shares]. This chapter's Palma arithmetic on those decile shares, the top 10 percent share divided by the bottom 40 percent share, gives 1.26 in 2010, 1.27 in 2016 and 1.18 in 2022. The divergence describes where the gains sat: in asset values, remittance corridors and enterprise income above the consumption basket the survey's expenditure module measures.
It is also a measurement warning chapter 53 owns: whichever Gini a ministry quotes decides whether the decade looks like success.
Who receives support, and how much?
The safety net is now wide. Coverage of social safety net programmes reached 54.37 percent of the population in the 2022 wave, up from 15.08 percent in 2010 and 40.70 percent in 2016, and coverage of the poorest quintile reached 69.34 percent, up from 23.68 percent in 2010 [WB ASPIRE 2022]. The household survey corroborates the scale: 37.6 percent of households received benefits in 2022 against 24.6 percent in 2010, and the beneficiary share of the population reached 50.0 percent from 28.7 percent in 2016 [BBS HIES 2022].
Wide is not deep. The adequacy measure, the transfer as a share of the beneficiary household's total welfare, was 1.62 percent in 2022, down from 3.99 percent in 2010 and 2.60 percent in 2016 [WB ASPIRE 2022]. The allowance table explains the arithmetic. The Department of Social Services records the FY2021-22 old age allowance at 57.01 lakh beneficiaries and 3,444.54 crore BDT, the widow and husband deserted women allowance at 24.75 lakh and 1,495.40 crore BDT, both at 500 taka a month, and the destitute disabled allowance at 20.08 lakh and 1,820 crore BDT at 750 taka a month [DSS 2022].
Five hundred taka a month against the 31,500 taka an average household spent monthly in 2022 is 1.6 percent, calculated from those figures, an illustration using an average household budget, not an independent derivation of the ASPIRE beneficiary-household adequacy measure. The three reported programme allocations sum to 6,759.94 crore BDT. Their share of total social-protection spending is not calculated here because a comparable official total has not been established.
A comparable official safety-net budget series has not been established here. The compiled series lacks an identified upstream publisher, so neither its levels nor its GDP shares are used as evidence. The Finance Division’s Budget in Brief and programme tables are needed to compare spending over time and distinguish pension expenditure from poverty-focused transfers.
The insurance column completes the diagnosis: social insurance coverage, contributions linked to formal employment, was 1.19 percent of the population in 2022 and 0.21 percent of the poorest quintile, with 1.03 percent of social insurance benefits reaching that quintile [WB ASPIRE 2022]. Unemployment and labour market programmes covered 1.57 percent of the population [WB ASPIRE 2022]. Bangladesh has built a poor relief system, not a social insurance state, and the informal workforce chapter 08 measures is exactly the population the contributory column does not touch.
Growth, transfers and payment delivery
Growth with generic assets did the lifting. The poverty elasticity of the FY10 to FY22 period ran through the mechanisms the companion chapters document: 6 percent era growth chapter 01 records, remittance flows chapter 08 tracks, rural road electrification and agricultural intensification that chapter 49 shows reached lagging districts ahead of institutions, and the garment wage flow that pulled women into cash income. None of these is a transfer programme, which is why extreme poverty fell to 5.6 percent while the average safety net benefit stayed near 2 percent of beneficiary welfare: the state's anti poverty instrument was the labour market, and the safety net's job was to mark the boundary, not to move it.
This is also why the system's own statistics show mild progressivity at trivial depth: 25.86 percent of safety net benefits reached the poorest quintile in 2022 against 21.63 percent in 2010, above the proportional 20 percent benchmark but only just [WB ASPIRE 2022].
The National Social Security Strategy is the design response and it is now mid life. Adopted in 2015 with the General Economics Division as author, the strategy reorganised the patchwork around life cycle stages and promised programme consolidation, a single beneficiary registry and programme budgeting [GED Plans 2015]. Its second phase runs through FY26, which makes the strategy's own decision year current; the phase targets and the consolidated programme count are not in any document available to this chapter, so specific numbers are not established; with the strategy documents the resolving source.
What the strategy did not bend is adequacy, which fell from 3.99 to 1.62 percent across its first decade [WB ASPIRE 2022], because benefit rates are fixed in nominal taka and repriced by political decision rather than by rule. The old age allowance's 500 taka a month, the FY2021-22 reading [DSS 2022], compounded against the FY23 general inflation print of 9.02 percent and the calendar 2023, 2024 and 2025 prints of 9.88, 10.47 and 8.77 percent [BBS CPI 2023] [WB WDI 2026], lost about a quarter of its purchasing power by FY26 calculated from the cited figures.
The food inflation the bottom of the distribution actually consumes ran ahead of that: 8.71 percent in FY23 [BBS CPI 2023], with coarse rice at 49.44 taka a kilogram in the latest price monitoring snapshot [HDX WFP 2026] and the food price mechanism chapter 59 traces. The real construction day wage chapter 08 shows falling 14.6 percent across FY16 to FY22 [BBS Wage 2022] is the same mechanism one link earlier: the labour market that lifted the poor has stopped outpacing the basket.
The delivery rail digitised before the benefit design did. In the 2022 beneficiary survey, 69.87 percent of government to person transfer recipients collected through mobile money agents, with satisfaction at 9.28 on a ten point scale, ranging from 8.41 in the northern poor pocket to 10.0 in the haor and hill tracts sites [Harvard Dataverse 2022]. DSS was already enrolling new disability allowance beneficiaries directly onto the digital channel in FY2021-22 [DSS 2022]. The compiled digital payment share series available to this chapter, rising from 15 percent in 2019 to 65 percent in 2025, is directionally consistent but of unidentified upstream provenance, and could not be confirmed, with the Finance Division the resolving source.
Digitisation changed the cost and auditability of delivery and created its own incidence: 6.08 percent of beneficiaries reported agents charging a cash out surcharge, 22.03 percent reported digital fraud or harassment, and PIN awareness was 58.19 percent, so two in five beneficiaries held a wallet they could not fully operate [Harvard Dataverse 2022]. The measured rail losses are visible and small per beneficiary; the deeper leak is exclusion, the 30.66 percent of the poorest quintile outside coverage, calculation from the cited figures on the 69.34 percent reading [WB ASPIRE 2022].
The food based programmes sit at the design frontier. The school feeding programme carries 1,091.61 crore BDT of FY26 allocation with zero cumulative expenditure against a 5,452.42 crore BDT cost [Planning Commission ADP 2025], which chapter 32 reads as the system's execution spectrum. The older in kind programmes in the vulnerable group feeding and development channels persist in the disaster relief and women affairs ministry budgets; no beneficiary or tonnage series for either is available to this chapter, so their scale is not established; with those ministries' annual reports the resolving sources.
The need is measured: 21.11 percent of the population reported moderate or severe food insecurity on the 2022 survey's experience scale [BBS HIES 2022], and average intake of 2,393 kilocalories per person a day in 2022 sat only 75 kilocalories above its 2010 reading [BBS HIES 2022]. A country that eats this close to its requirement prices every allowance in rice, which is why indexation is not a technicality.
Decisions on coverage and adequacy
Four decision points define the window, and the first is measurement. The welfare record ends at the 2022 survey; on the roughly six year cadence the series follows, the next print lands in the window the chapter 15 scenarios assume, and until it arrives every claim about the post 2022 reversal, including this chapter's, rests on the inflation record: 9.02 percent FY23 general inflation, 9.88 and 10.47 percent across calendar 2024 and 2025 [BBS CPI 2023] [WB WDI 2026], with the IMF projecting 9.2 percent average inflation for FY26 [IMF WEO 2026].
Three years of inflation at that level against a safety net budget flat near 2.5 percent of GDP is a mechanical real cut to the bottom of the distribution, and the state cannot see it. The measurement decision, led by BBS with the Statistics and Informatics Division, is whether a smaller, faster welfare round, or at least the price module and transfer receipts of the quarterly instruments, closes the gap before the next full survey; the reversal's size is the indicator this chapter cannot yet print.
The second decision is indexation and benefit design, led by the Finance Division with the social welfare and disaster ministries. The instrument is a rule, not a number: anchor core allowance rates to the food CPI or the poverty line and reprice annually, and merge the long tail of micro programmes whose individual books are too small to matter. The 6,759.94 crore BDT this chapter sums across the three largest cash allowances [DSS 2022] is the base a rule would protect; the envelope grows every year while depth falls, the outcome a rule removes. The school feeding book and the in kind channels belong in the same consolidation, because 21.11 percent food insecurity [BBS HIES 2022] is a stunting and learning input as much as a welfare output, the mechanism chapter 09 and chapter 32 price.
The third decision is contributory coverage, and the universal pension scheme is its instrument. The scheme's enabling law passed in 2023 and subscription opened in FY24, extending voluntary contributory pensions outside the civil service for the first time; the design is public policy, but the registration and contribution series are not available to this chapter, so uptake numbers are not established; with the Finance Division pension authorities the resolving source, and chapter 38 tracks the uptake. The design question this chapter owns is the fit with the labour force: a voluntary scheme with a 1.19 percent social insurance base [WB ASPIRE 2022] and an 84 percent informal workforce [ILO 2025] recruits from the payroll that exists, the garment factories and formal services, and the policy choice is whether enrolment is tied to the formalisation levers chapter 08 lists, payroll registration and contract hiring, so the pension follows the wage.
The fourth decision is fiscal. The safety-net budget needs to be reconciled with the official programme accounts before its GDP share is used. The revenue base remains narrow, at the 7.64 percent of GDP reading chapter 01 records [WB WDI 2026], and the financing environment chapter 02 and chapter 04 describe, LDC graduation thinning grant windows and the IMF programme's floors, means the envelope, growing to 126,272 crore BDT in FY25 in the compiled series (not confirmed; the Finance Division budget in Brief would resolve it), competes with interest, subsidies and the development programme. The ageing arithmetic is one sided: the old age dependency ratio of 9.92 per 100 working age persons in 2024 [WB WDI 2026] crosses the threshold chapter 08 dates inside the scenarios' horizon, and every point of it converts allowance recipients from a discretionary line into an entitlement the state cannot renege on without visible cruelty.
The state that arrives at 2036 with allowances still priced in 2022 taka, the outcome the stall scenario assumes, will be running a poverty increasing programme with a poverty reducing label.
How to test the argument. The Finance Division and Department of Social Services should report who receives support, its real value and the costs of delivery. If digital collection expands while exclusion or benefit erosion persists, delivery reform has not solved the underlying protection problem.
Risks and opportunities
Risks. First, the statistics fog: if the next full survey slips past the cadence the series follows, the 18.7 percent headcount becomes a political number quoted as current against a decade later reality nobody has measured, and budget decisions compound on a stale base; monitor the survey calendar and the price module's continuity. Second, adequacy collapse: if core allowance rates hold nominal while inflation prints stay above 8 percent, the adequacy measure falls below 1 percent of beneficiary welfare from its 1.62 percent 2022 reading [WB ASPIRE 2022]; monitor the repricing decisions in successive budgets and the food inflation series chapter 05 tracks.
Third, a digitisation backlash: if agent surcharges and fraud rise from their 6.08 and 22.03 percent 2022 readings [Harvard Dataverse 2022] as coverage extends into older and more remote populations, the rail's legitimacy breaks and the political response, a reversion to cash distribution, would restore the leakage the rail removed; monitor the next beneficiary survey's incidence rows.
Upside. First, the rail is the platform: a country where 69.87 percent of beneficiaries already collect digitally [Harvard Dataverse 2022] can run shock responsive transfers, the flood and cyclone need chapters 11 and 29 document, through the same pipe with lower delivery costs where the existing channel works; programme funding and administrative costs would still need to be measured, and can index benefits by rule because the audit trail exists; monitor the first allowance repricing executed automatically on a CPI trigger. Second, contributory formalisation: if the pension scheme and the formalisation levers pull even the reform scenario's share of own account workers onto contribution schedules, the ageing bill of the 2040s chapter 08 prices is funded by payroll rather than by the budget line this chapter audits; monitor pension registration series and the wage employment share.
Third, consolidation buys depth: merging the programme tail and the registry into the NSSS's design frees the administrative budget duplicate delivery consumes, and even a fixed envelope repriced to the poorest quintile would move adequacy from 1.62 percent toward the 4 percent the system already delivered in 2010 [WB ASPIRE 2022]; monitor the programme count and registry status after the FY26 phase close.
Social-protection indicators to follow
The benchmarks below are author-proposed monitoring points, not validated causal cutoffs or official forecasts.
- National upper poverty headcount. Current value 18.7 percent in the 2022 survey [BBS HIES 2022]. Proposed benchmark: the next print above 20 percent may indicate the inflation reversal as regime rather than pause; a print below 15 percent may indicate the growth engine resumed the FY10 to FY22 pace.
- Income Gini coefficient. Current value 0.499 in 2022, urban 0.539 [BBS HIES 2022]. Proposed benchmark: a print above 0.52 may indicate the distribution regime in which growth stops moving the bottom two quintiles' income share; a widening income versus consumption Gini gap would indicate measurement rather than distribution driving the story.
- Safety net adequacy. Current value 1.62 percent of beneficiary household welfare in 2022 [WB ASPIRE 2022]. Proposed benchmark: a reading below 1 percent may indicate the inadequate benefits; a recovery above 4 percent, the 2010 level, means indexation or consolidation has landed.
- Poorest quintile coverage. Current value 69.34 percent in 2022 [WB ASPIRE 2022]. Proposed benchmark: a fall below 60 percent with flat budgets may indicate exclusion growing through digitisation and registry errors; a print above 80 percent with rising adequacy is the targeted system the NSSS designs for.
- Digital delivery incidence. Current values 69.87 percent of beneficiaries collecting through mobile agents, 6.08 percent paying surcharges and 22.03 percent reporting fraud or harassment in the 2022 survey [Harvard Dataverse 2022]. Proposed benchmark: surcharge incidence above 10 percent or fraud above 30 percent may indicate the rail becoming a leakage channel; a registry that reconciles beneficiary, wallet and PIN awareness above 80 percent is the audit ready system.
Sources
[BBS HIES 2022] Bangladesh Bureau of Statistics, Household Income and Expenditure Survey 2022 via bdpolicy.db and the bbs_hies_indicators_bd parquet: poverty headcounts upper and lower lines, national, rural and urban, income Gini coefficients, income decile and top and bottom five percent shares, monthly household expenditure, daily calorie intake, safety net household coverage and beneficiary share, moderate or severe food insecurity.
[WB WDI 2022] World Bank Poverty and Inequality Platform Bangladesh extract via the wb_pip_bd and wb_poverty_bd parquets: headcounts at the international lines, consumption decile shares, including the 3.00 and 4.20 dollar series tags chapter 01 carries.
[WB WDI 2026] World Bank World Development Indicators via bdpolicy parquets and the indicators snapshot 2026-09-04, series: SI.POV.GINI, SP.POP.DPND.OL, wb_cpi_inflation, wb_tax_revenue_pct_gdp.
[WB ASPIRE 2022] World Bank Atlas of Social Protection: Indicators of Resilience and Equity, Bangladesh HIES based waves 2005 to 2022 via the social_protection/wb_aspire_bd parquets, series: per_sa_allsa.cov_pop_tot, per_sa_allsa.cov_q1_tot, per_sa_allsa.adq_pop_tot, per_sa_allsa.ben_q1_tot, per_si_allsi.cov_pop_tot, per_si_allsi.cov_q1_tot, per_si_allsi.ben_q1_tot, per_lm_alllm.cov_pop_tot.
[OPHI MPI 2024] Oxford Poverty and Human Development Initiative and UNDP global Multidimensional Poverty Index, Bangladesh national series, DHS 2014, MICS 2019 and DHS 2022 waves, via lake/poverty/mpi_subnational_trends_bd.parquet.
[ILO 2026] ILOSTAT modelled working poverty rate via the bdpolicy indicators snapshot 2026-09-04, series: ilo_working_poverty_rate.
[ILO 2025] ILOSTAT modelled informal employment share for 2024, as cited in chapter 08, series: ilo_emp_nifl_sex_age_rt_a.
[DSS 2022] Department of Social Services annual report 2021-22 via ocr_text/mosw: old age, widow and husband deserted women, and destitute disabled allowance beneficiary counts, budget allocations and monthly benefit rates, G2P enrolment statements.
[Harvard Dataverse 2022] G2P beneficiary payment collection survey, DOI 10.7910/DVN/V4EKDG, series: ssn_g2p_mobile_agent_share_pct, ssn_g2p_agent_extra_fee_incidence_pct, ssn_g2p_fraud_harassment_rate_pct, ssn_g2p_pin_awareness_rate_pct, ssn_g2p_national_satisfaction_score and the four regional satisfaction rows.
[BBS CPI 2023] Bangladesh Bureau of Statistics national consumer price inflation via bdpolicy.db, series: bbs_inflation_national_general, bbs_inflation_national_food.
[HDX WFP 2026] UN World Food Programme price monitoring via the bdpolicy indicators snapshot 2026-09-04, series: hdx_wfp_rice_coarse_price.
[IMF WEO 2026] IMF World Economic Outlook projection for FY26 average inflation via the indicators snapshot, series: imf_cpi_inflation_avg, as cited in chapter 05.
[BBS Wage 2022] Bangladesh Bureau of Statistics construction daily wage rates, as cited in chapter 08 for the FY16 to FY22 real wage record.
[GED Plans 2015] National Social Security Strategy 2015, General Economics Division, Planning Commission; document not held in the sources this chapter draws on, cited for design intent, with numeric targets marked not confirmed in the text.
[Planning Commission ADP 2025] Annual Development Programme revised programme FY2025-26 tables, school feeding line as cited in chapter 32.