Garment growth depends on value retained
Ready made garment exports reached 50.90 billion USD in the 2024 BACI record, accounting for 86.6 percent of merchandise exports [BACI 2024]. Export value grew, but the basket's average value per kilogram changed much less. That aggregate unit value reflects product mix as well as prices, so it cannot measure price pressure on an unchanged garment by itself. Market access, input sourcing, productivity and labour conditions together determine how much value Bangladesh retains.
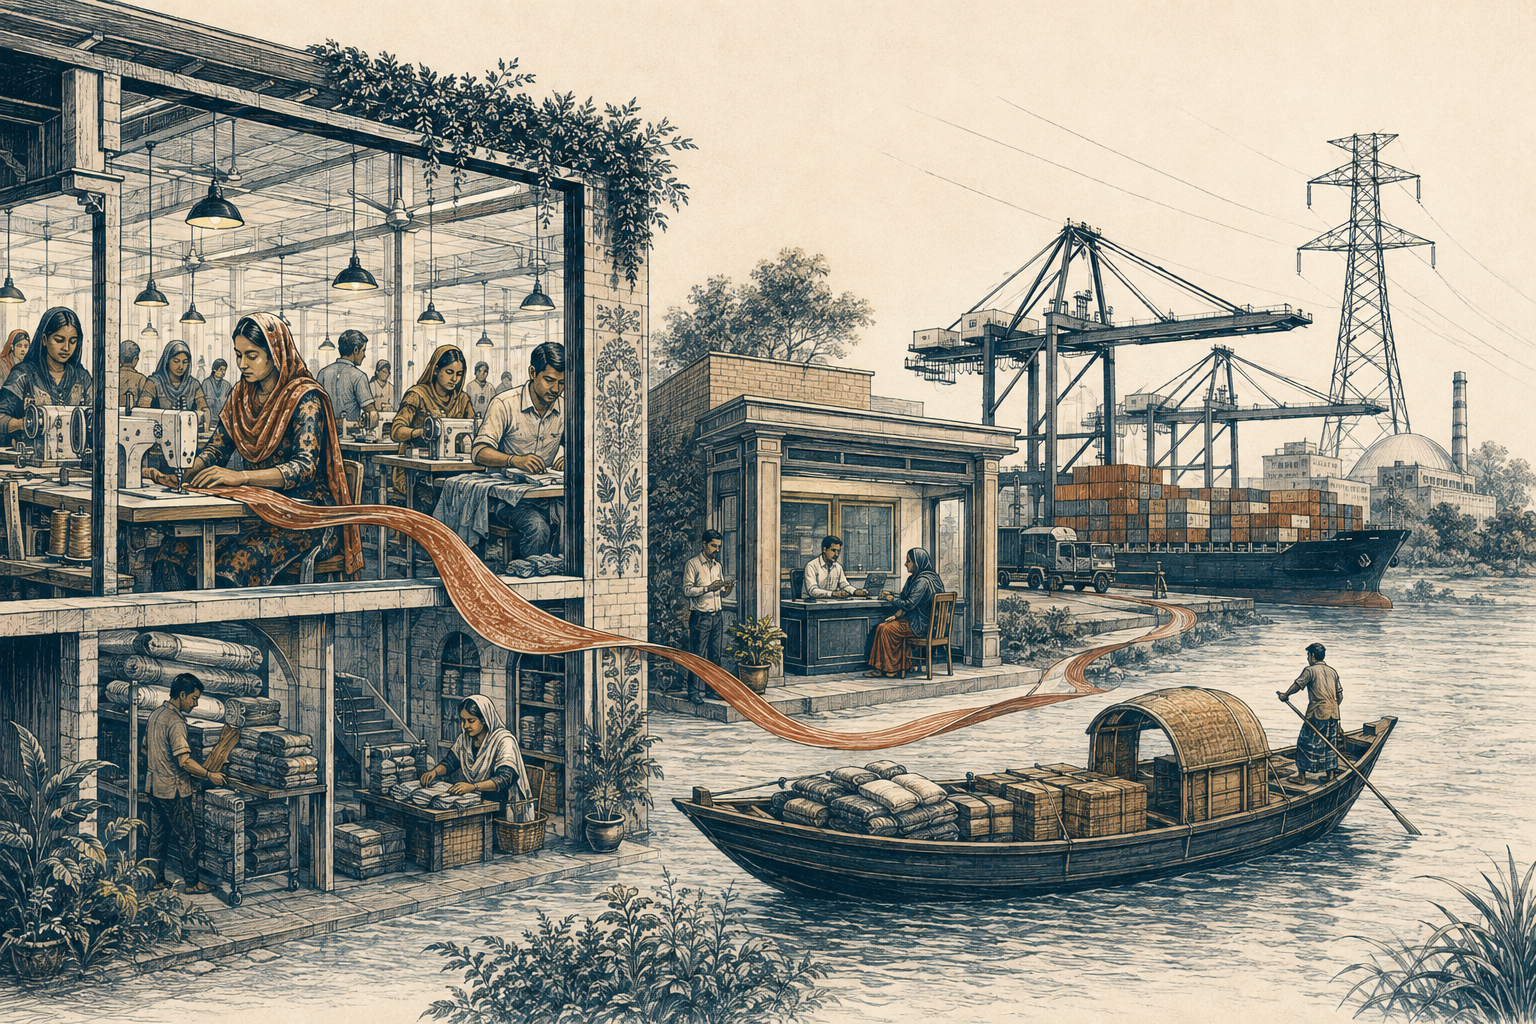
Exports, unit values and production capacity
The export record at HS6 resolution is the deepest available measure of the industry. Garment exports, HS chapters 61 and 62, ran 39.22 billion USD in 2018, 40.62 in 2019, fell 13 percent to 35.25 in the pandemic year 2020, recovered to 44.46 in 2021 and 56.30 in 2022, then eased to 49.66 in 2023 and 50.90 in 2024 [BACI 2024], all calendar years. The share of merchandise exports held between 84.0 and 86.6 percent across the window, printing 86.6 in 2024 [BACI 2024], the concentration number chapter 02 carries and the chapter 15 dashboard watches.
Knitwear out-sold woven throughout: 27.47 billion USD against 23.43 in 2024, a ratio of 1.17 [BACI 2024], the ratio chapter 02 tracks against its 1.4 origin-migration threshold. The 2022 peak and 2023 fall is the post-pandemic normalisation, and the 2024 recovery to 50.90 is the first confirmation that the level holds.
The price record is the number this chapter adds to chapter 02. The implied unit value, export value divided by exported weight across the HS61 and HS62 chapters, was 18.96 USD per kg in 2015, 18.82 in 2019, and 19.73 in 2024 [BACI 2024]. Priced in taka on the BIS annual average rates of 77.95 per USD in 2015 and 115.60 in 2024 [BIS 2026], the same kilogram moved from 1,478 to 2,281 taka, a rise of 54 percent, while the consumer price index rose 81.3 percent on the IMF all items index, 69.5 to 126.0 over the same years [IMF WEO 2025].
The computation values the annual basket at annual average rates rather than weighting each shipment by month, so it is an approximation: the real taka price of a kilogram of Bangladeshi garments fell about 15 percent in nine years. The industry's response was volume; the kilogram record, not the price record, carries the growth. The taka's own slide steepened after 2021, from 85.8 to 122.3 per USD at month-end between end 2021 and end 2025, a 42.5 percent rise in the taka price of a dollar, equivalent to a 29.8 percent fall in the taka’s dollar value [BIS 2026], which kept dollar costs competitive even as the dollar price stagnated.
The value added record shows why the price matters. The OECD Trade in Value Added database places the domestic value added share of Bangladesh's textiles, apparel and leather gross exports, the industry group that holds garments, at 74.2 percent in the latest stored year, 2020, with the foreign share at 25.8 [OECD TiVA 2023]. The foreign quarter is imported fabric and inputs, and the import record shows its scale: HS chapters 52 to 55, cotton, other vegetable fibres and man made fibres from raw fibre and yarn through to fabric, were imported to the value of 14.12 billion USD in 2022 and 12.37 billion in 2024 [BACI 2024], of which the cotton chapter 52 alone was 9.39 billion in 2022 and 7.69 billion in 2024, raw cotton on line 5201 at 2.53 billion in 2024 [BACI 2024].
Backward linkage, the domestic spinning and weaving that chapter 02's double transformation argument depends on, is the difference between the knit share, which uses domestic yarn and carries the higher domestic value added, and the woven share, which imports fabric and imports the origin risk.
The scale record is measured and it is association-sourced. The BGMEA register counted 5,876 member factories in 2013 and 4,222 in 2014 after the post Rana Plaza consolidation, and 4,621 by 2019, the latest stored count [BGMEA 2019]; employment on the association's series has been 4.0 million workers since 2012 [BGMEA 2019]. The industry is the largest formal employer of women in the country: the female wage and salaried share rose from 18.78 to 34.22 percent between 2010 and 2024, mostly through ready made garments, on the series chapter 08 carries [WB WDI 2026]. The wage settlement is relevant to labour costs and living standards. The applicable statutory wage amounts need confirmation against the Minimum Wage Board's primary notices before a current real-wage comparison can be made. Compare the applicable schedule, consumer prices, hours and productivity before assessing changes in real earnings or competitiveness.
The buyer geography is chapter 02's destination record read as demand: the European Union took 52.4 percent of 2024 merchandise exports, 30.82 of 58.81 billion USD on the audit recomputation of chapter 02's destination table with the full EU27 mapping, and the United States 14.8 [BACI 2024]. The garment-specific split by destination could not be confirmed here, the available HS6 series carrying no partner dimension and the available bilateral series carrying no product dimension, EPB destination tables by product being the resolving source; the two-bloc structure is nonetheless chapter 02's firmest finding, an EU regime that runs through EBA to the GSP+ application [EU GSP 2023], and a US regime that has always been full price.
Market access, wages, inputs and compliance
The first gear is the preference regime chapter 02 dates: duty free access to the EU under Everything But Arms through end-2029 on the transition timetable the Union targets [EU GSP 2023], and the GSP+ application, which the transition plan targets for 2028 [EU GSP 2023] and which carries the convention list of the scheme in force at filing, 27 conventions under Regulation 978/2012 and 32 under the reformed scheme the Commission's GSP page now describes [EU GSP 2023]. The preference is why the EU share exceeds the US share, and the cliff is now measurable rather than asserted: EU most favoured nation duties on apparel carry no duty free line among the 34 apparel HS4 positions, a simple average of 11.0 percent, a median of 12.0 and a peak of 12.0 [WB WITS 2023, reporter EU27, HS chapters 61 and 62].
The difference between zero and 11 to 12 percent on 52.4 percent of exports is the tariff arithmetic chapter 02 sizes.
The second gear is the wage gap. The statutory wage amounts and a comparable cross-country labour-cost series were not established here. Exchange rates are one input to that comparison: the rise in BDT per USD described in chapter 05 changed dollar-denominated wage costs [BIS 2026] even as inflation of 10.47 percent in calendar 2024 [WB WDI 2026] ate the real wage chapter 08 records. The gap is why orders came; its erosion is why automation and relocation questions now circulate in buyer sourcing.
The third gear is backward linkage, and it is the one the decade can still turn. The textile input import bill of 12.37 billion USD in 2024 [BACI 2024] is the industry's largest import line, and every billion substituted into domestic weaving is a billion of domestic value added at the 74.2 percent domestic share the TiVA record gives the textiles, apparel and leather group [OECD TiVA 2023]. Knitwear made the substitution a generation ago, which is why knit carries the 27.47 to 23.43 lead and the safer origin; woven's substitution is the economic content of the cumulation question chapter 02 poses.
The fourth gear is compliance as market access, and it now has a measured worker-level record. The association's stored publication counts 153 LEED certified green garment factories certified by the United States Green Building Council [BGMEA 2021]. The safety architecture after Rana Plaza, the Accord's inspections and its successor the RMG Sustainability Council, is qualitative in the available evidence, and the count of inspectors and remediation closures could not be confirmed here, the ILO roadmap documents being the resolving source [ILO 2025]. What is measured is the workforce the architecture covers: in the 2,500 worker survey fielded in November 2023, 44.52 percent reported one or more workplace injuries, 17.52 percent had received no formal occupational safety training, 22.0 percent worked in high job risk conditions, mean weekly hours were 48.03 and 28.12 percent reported chronic health conditions [Zenodo 2023].
A decade after the Accord, injury prevalence near 45 percent and a sixth of the workforce unschooled in safety is the gap between certified buildings and safe work, and it is the number buyer due diligence regimes will read, the mechanism chapter 58 develops from the labour side.
Two domestic gears mesh with these. The geography is a corridor: factories sit along the Dhaka-Chattogram belt and the port chapter 23 measures, so a capacity payment failure in chapter 10 or a customs slowdown in chapter 23 is an export shock inside the same shipping cycle. And the finance is concentrated: a handful of large groups hold most of the export capacity, the related-party lending chapter 06 names ran through the same conglomerates, and the industry's working capital repriced with the monetary regime chapter 05 documents, the weighted average advance rate reaching 11.52 percent in FY24 [BB AR 2024, annual report FY24, interest rates on deposits and advances]. A sector whose international price is flat and whose working capital cost has risen is a sector whose margin lives in volume and speed.
The shocks the mechanism absorbed are the record's stress tests. The pandemic cut garment exports 13 percent to 35.25 billion USD in 2020 [BACI 2024] and the fall ran into the balance of payments chapter 03 tracks; the 2022 demand boom carried the industry to 56.30 billion while the energy crisis of that winter forced the generation cuts chapter 10 records; the 2024 transition and the internet shutdown it brought interrupted shipments at the margin [Not confirmed, chapter 13]. Through all three the export share held above 84 percent [BACI 2024], which is the industry's resilience and the economy's concentration in one fact.
Decisions on tariffs, fabric and productivity
Four forces set the path. First, the tariff regime: the EBA end the Union targets for end-2029, the GSP+ application the transition plan targets for 2028 [EU GSP 2023], and the measured EU apparel duty of 11.0 percent simple average and 12.0 peak [WB WITS 2023] define the 2029-2030 cliff that the GSP+ scenario chapter 02 discusses. Second, the price regime: a 4 percent unit value trend [BACI 2024] against buyer consolidation and near-shoring competition means the volume machine needs product upgrade, technical textiles and man made fibre garments, whose import dependence is the 4.08 billion USD man made fibre input bill of 2024, HS chapters 54 and 55 [BACI 2024].
Third, the energy and compliance transition: buyer decarbonisation demands run into a renewables share of 2.14 percent of generation in calendar 2025 [Ember 2025], the share chapter 10 records, so the green factory programme [BGMEA 2021] either gets grid-scale clean power behind it or becomes a ceiling on premium orders. Fourth, the labour transition: the next wage board settlement lands mid-window, and the formalisation dividend chapter 08 discusses depends on the industry that employs the largest block of formal working women [WB WDI 2026].
No garment-specific projection for FY36 is stored in the cited data, and any figure projected for garment exports in FY36 is not established, with World Bank and ILO sector work the named authors that could support a forecast. The decision points are therefore three, each owned by a named process: the cumulation and origin decision chapter 02 examines, which decides woven's fate; the energy pricing decision chapter 10 examines, which decides whether green factories get green power; and the wage settlement, whose gazette decides whether the cost gap survives the decade.
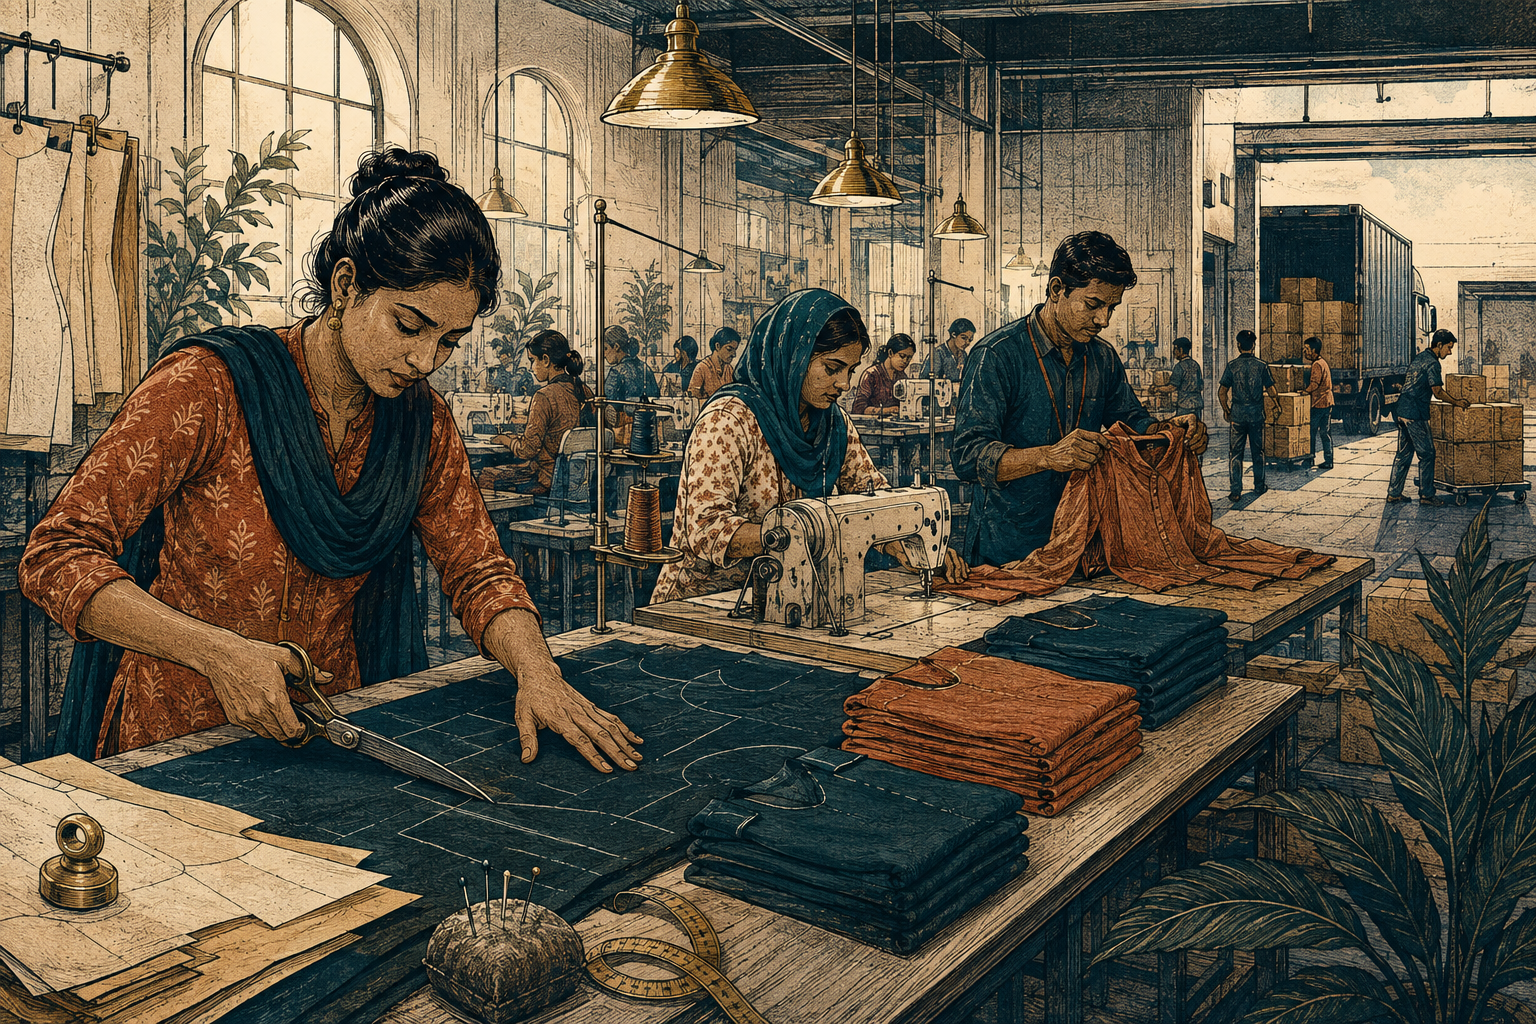
Risks and opportunities
Risks. First, the tariff cliff without cumulation: the EU at 52.4 percent of exports [BACI 2024] facing duties of 11 to 12 percent [WB WITS 2023] if GSP+ fails is a contraction arithmetic chapter 02 sizes, and the indicator to monitor is the GSP+ application filing date. Second, the price-erosion squeeze: if unit values hold near 19.73 USD per kg [BACI 2024] while wages, compliance and 11.52 percent working capital [BB AR 2024, annual report FY24, interest rates on deposits and advances] all cost more, margins close in the middle of the value chain, and the injury and training gaps in the 2023 workforce record [Zenodo 2023] are the compliance costs queuing behind the wage bill; the indicator to monitor is the unit value series and the fabric import bill's composition.
Third, an energy credibility failure: buyer decarbonisation terms against a 2.14 percent renewables share [Ember 2025] would cap the premium segment, and the indicator to monitor is the renewable share of the grid at the garment clusters.
Upside. First, woven substitution: each billion of domestic fabric displaces imports and raises the domestic value added share of the textiles, apparel and leather group above the 74.2 percent stored reading [OECD TiVA 2023], and the indicator to monitor is the fabric import bill's trend against garment export growth. Second, the compliance premium: the 153 LEED certified factories [BGMEA 2021] and the safety architecture position the industry for the orders that pay for compliance, if power and certification follow, and the indicator to monitor is the LEED count and the export unit value moving together.
Third, the man made fibre turn: the 4.08 billion USD man made fibre import base of 2024, HS chapters 54 and 55 [BACI 2024] is the demand signal for the synthetic backward linkage the industry has not yet built, and the indicator to monitor is the domestic spinning and weaving order book in that fibre.
Testing the policy case
The commerce ministry, producers and labour institutions should compare product-level export performance with wages, productivity and compliance outcomes. Higher aggregate unit values caused only by a changing product mix would not prove price upgrading. Export growth accompanied by worsening worker outcomes would also require a different assessment of success.
What to watch
The thresholds below are author-proposed monitoring markers, not official targets or estimated policy effects. Interpret them alongside the source dates and definitions.
- Garment export value. Latest cited value 50.90 billion USD in calendar 2024 [BACI 2024]. Threshold: a fall below 45 billion marks the demand regime breaking; a sustained print above 55 marks the post-graduation regime holding.
- RMG share of merchandise exports. Latest cited value 86.6 percent in 2024 [BACI 2024]. Threshold: below 80 would be consistent with the diversification chapter 02 targets; above 88 would indicate concentration deepening into the cliff.
- Knit-to-woven ratio. Latest cited value 1.17, 27.47 against 23.43 billion USD [BACI 2024]. Threshold: above 1.4 signals woven orders migrating under origin pressure; a fall toward 1.0 with rising totals signals domestic fabric capacity absorbing the transition.
- Garment unit value. Latest cited value 19.73 USD per kg in 2024, computed on the reported value and weight series [BACI 2024]. Threshold: a sustained move above 21 marks the product-upgrade regime; a fall below 18 would be consistent with the price-erosion squeeze.
- Textile-input imports. HS chapters 52-55 imports totalled 12.37 billion USD in 2024 [BACI 2024]. These chapters include fibres and yarn as well as fabrics. Monitor the components separately: a lower total alone does not demonstrate fabric substitution, and a higher total may accompany greater domestic processing.
Sources used
[BACI 2024] CEPII bilateral trade at HS6 via the trade/bd_hs6_trade parquet, series: bd_hs6_trade, HS chapters 61, 62, 52, 54, 55 and line 520100; unit value computed from export value divided by export weight, weights in tonnes.
[BACI 2024] CEPII bilateral trade via the trade/bd_bilateral parquet, destination shares as recomputed in chapter 02.
[BIS 2026] Bank for International Settlements USD/BDT series via bdpolicy.db, series: bis_usd_bdt_annual_avg, bis_usd_bdt_monthly_eop.
[IMF WEO 2025] IMF consumer price index, All Items, via the curated/tradeweave_imf/imf_cpi_bd parquet, series: imf_cpi_bd, index levels 2015 and 2024.
[EU GSP 2023] European Commission GSP regulation and EBA transition timetable, cited from chapter 02.
[WB WITS 2023] World Bank World Integrated Trade Solution applied tariff statistics via the curated/tradeweave/tariff_hs4_summary parquet, series: tariff_hs4_summary, reporter EU27, MFN simple average, median and peak on the 34 apparel HS4 lines, no duty free lines.
[OECD TiVA 2023] OECD Trade in Value Added via bdpolicy.db, series: oecd_tiva_dva_rmg_share, oecd_tiva_fva_rmg_share, industry group textiles, apparel and leather, latest stored year 2020.
[BGMEA 2021] BGMEA publication Rise of a Phoenix via ocr_text/bgmea, 153 LEED certified green garment factories certified by the United States Green Building Council.
[BGMEA 2019] BGMEA factory register and employment series via bdpolicy.db, series: bgmea_rmg_factories_count, bgmea_rmg_employment_million, counts to 2019.
[Zenodo 2023] Garment worker job risk survey, 2,500 workers, November 2023 fieldwork, DOI 10.5281/zenodo.17117330, via bdpolicy.db, series: rmg_workforce_injury_prevalence_pct, rmg_workforce_no_safety_training_pct, rmg_workforce_high_risk_pct, rmg_workforce_mean_weekly_hours_nos, rmg_workforce_chronic_morbidity_pct.
[ILO 2025] ILO sector documents and the national roadmap via the registry ILO row; inspection and remediation counts not held in the available data used by this chapter.
[WB WDI 2026] World Bank World Development Indicators via bdpolicy.db, series: SL.EMP.WORK.FE.ZS (wage and salaried workers, female, percent of female employment), FP.CPI.TOTL.ZG (consumer price inflation, annual percent).
[BB AR 2024] Bangladesh Bank annual report FY24, weighted average interest rates on advances.
[Ember 2025] Ember yearly electricity data via the climate/ember_yearly_bd parquet, series: ember_yearly_bd, renewables share of generation calendar 2025.
[Not confirmed, chapter 13] Internet shutdown event claims, qualitative reading, resolving sources not in registry.